New from Incanus Ltd COMING SOON
SCADA and production monitoring, built for speed
We've been working hard on a new product. INCANUS is a complete system: the Incanus Hub server that collects every count, event and measurement from your plant; live screens that open in any browser, on any device; fast reports with a report writer built in; and the Incanus Designer to draw it all, from a simple status board to a 3D view of the whole factory.
// The system
One Hub server per site gathers the data, works out the figures, stores the history and serves the screens. Build the screens once in the Designer and every browser on the network shows them live.
The server. It reads PLCs through OPC UA and MQTT, runs counts, machine events and monitors, keeps shift and hour totals, and stores history in the database you choose. It runs as a Windows service, with its own MQTT broker and web server built in.
Open the Hub's address in a browser and the screens are there. Nothing to install on the client: desktop, wall display, tablet or phone. Values arrive as they change. Reports run on the Hub's history and export to Excel.
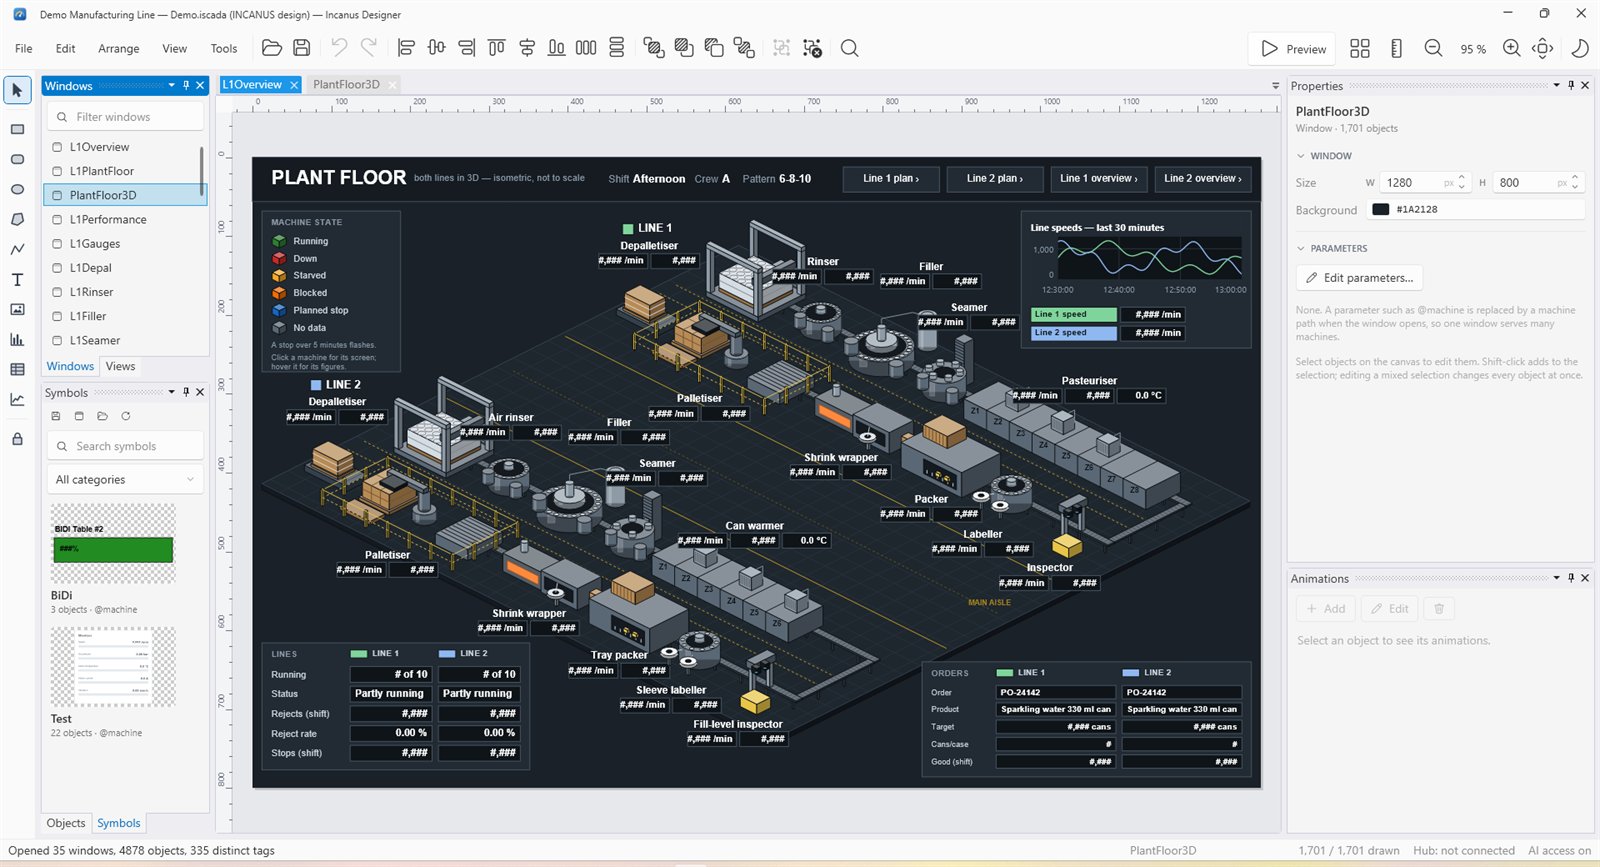
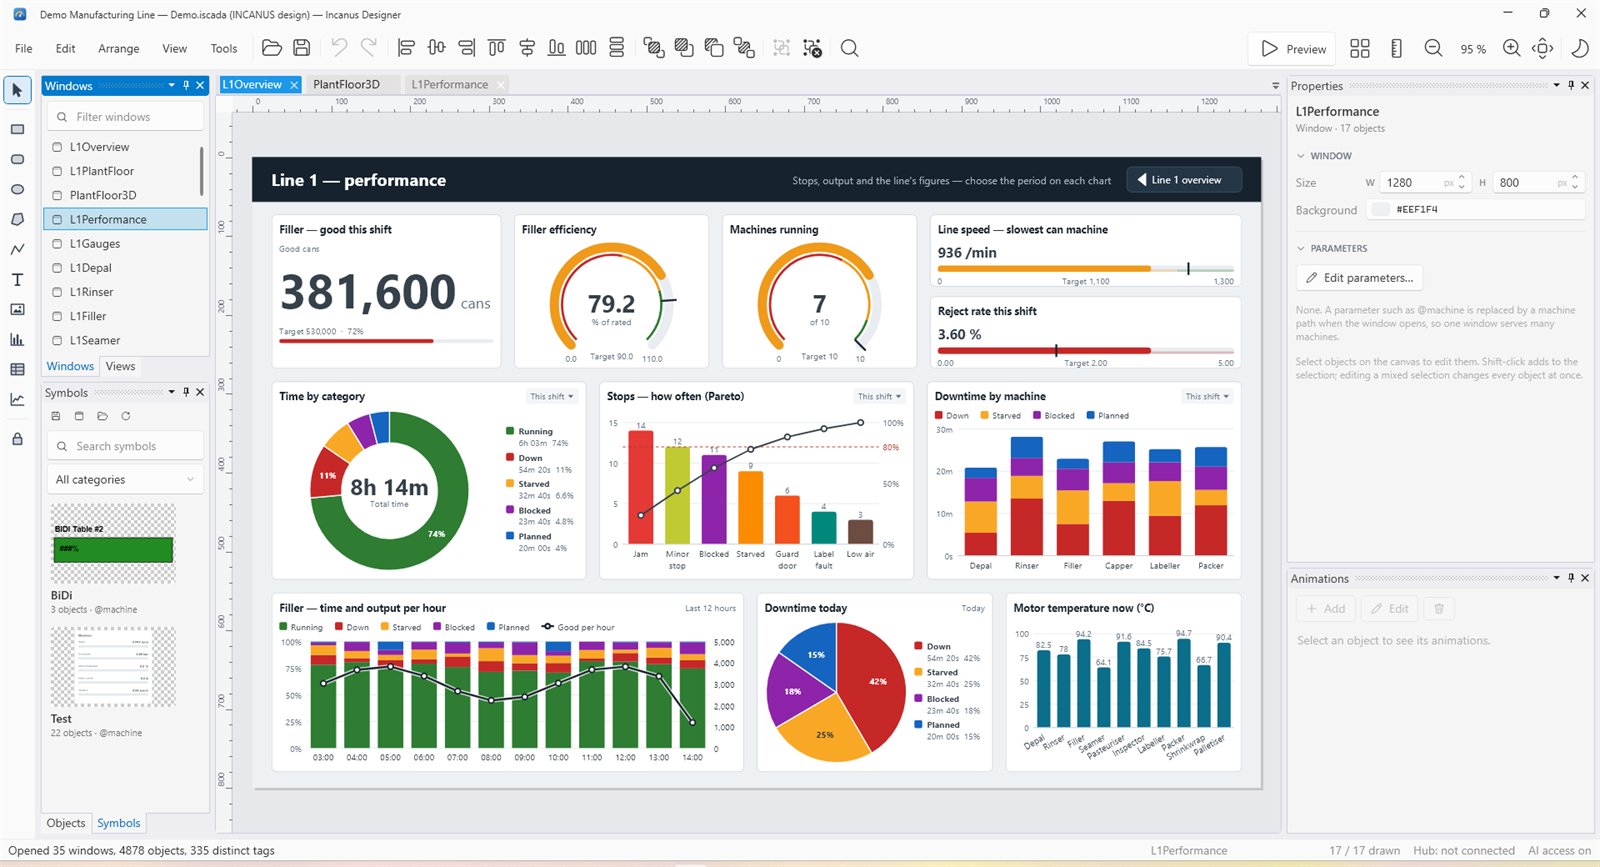
A modern Windows designer for the screens: shapes, text, images, charts, grids and trends, with animations bound to Hub tags. It has rulers, guides, snapping, a symbol library, undo for everything, and a live preview using real values.
Values reach the screen as they change, over MQTT. History is stored as time series with minute, hour and shift summaries ready-made, so charts and reports come back quickly.
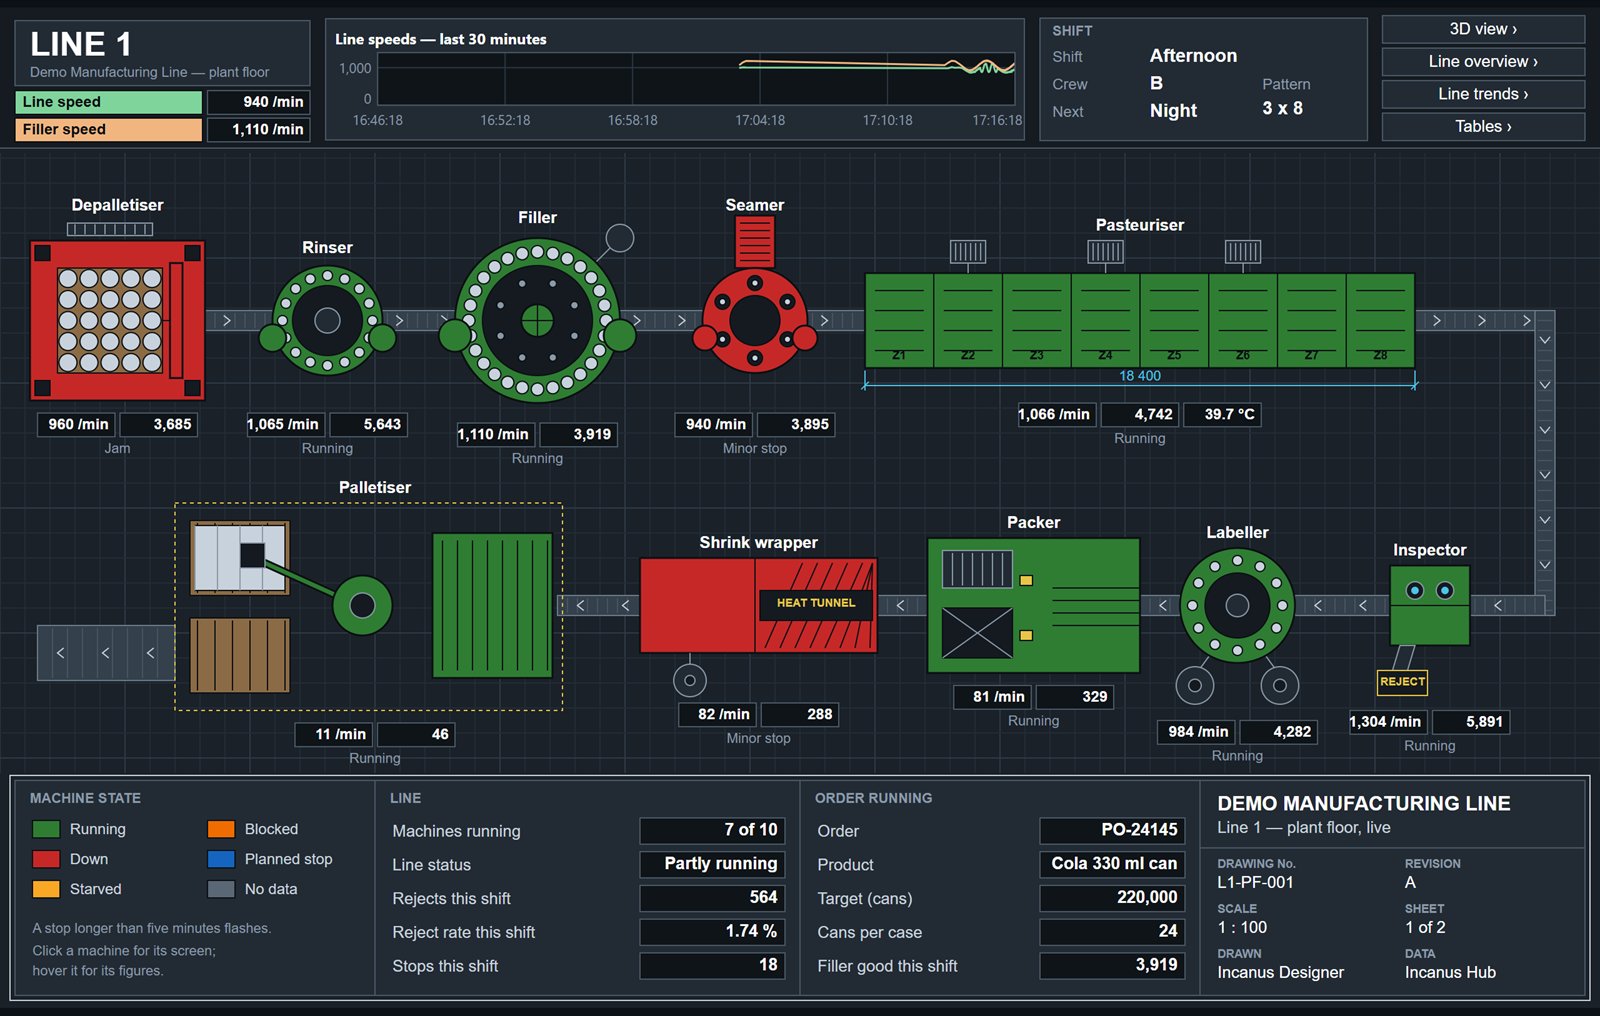
Modern charts, gauges, grids and trends, light or dark, crisp at any size. Make a screen as plain or as rich as the plant needs, up to a full 3D floor.
SQL Server, MySQL or SQLite for history. OPC UA, MQTT, SQL queries and Excel for data. Shifts, crews and groups set up to match how your site works.
The Hub is built to keep running. If the database or a source drops out, it carries on and catches up. Bad values are skipped, every change is logged and can be undone, and the Designer saves recovery copies so work isn't lost.
// Live screens
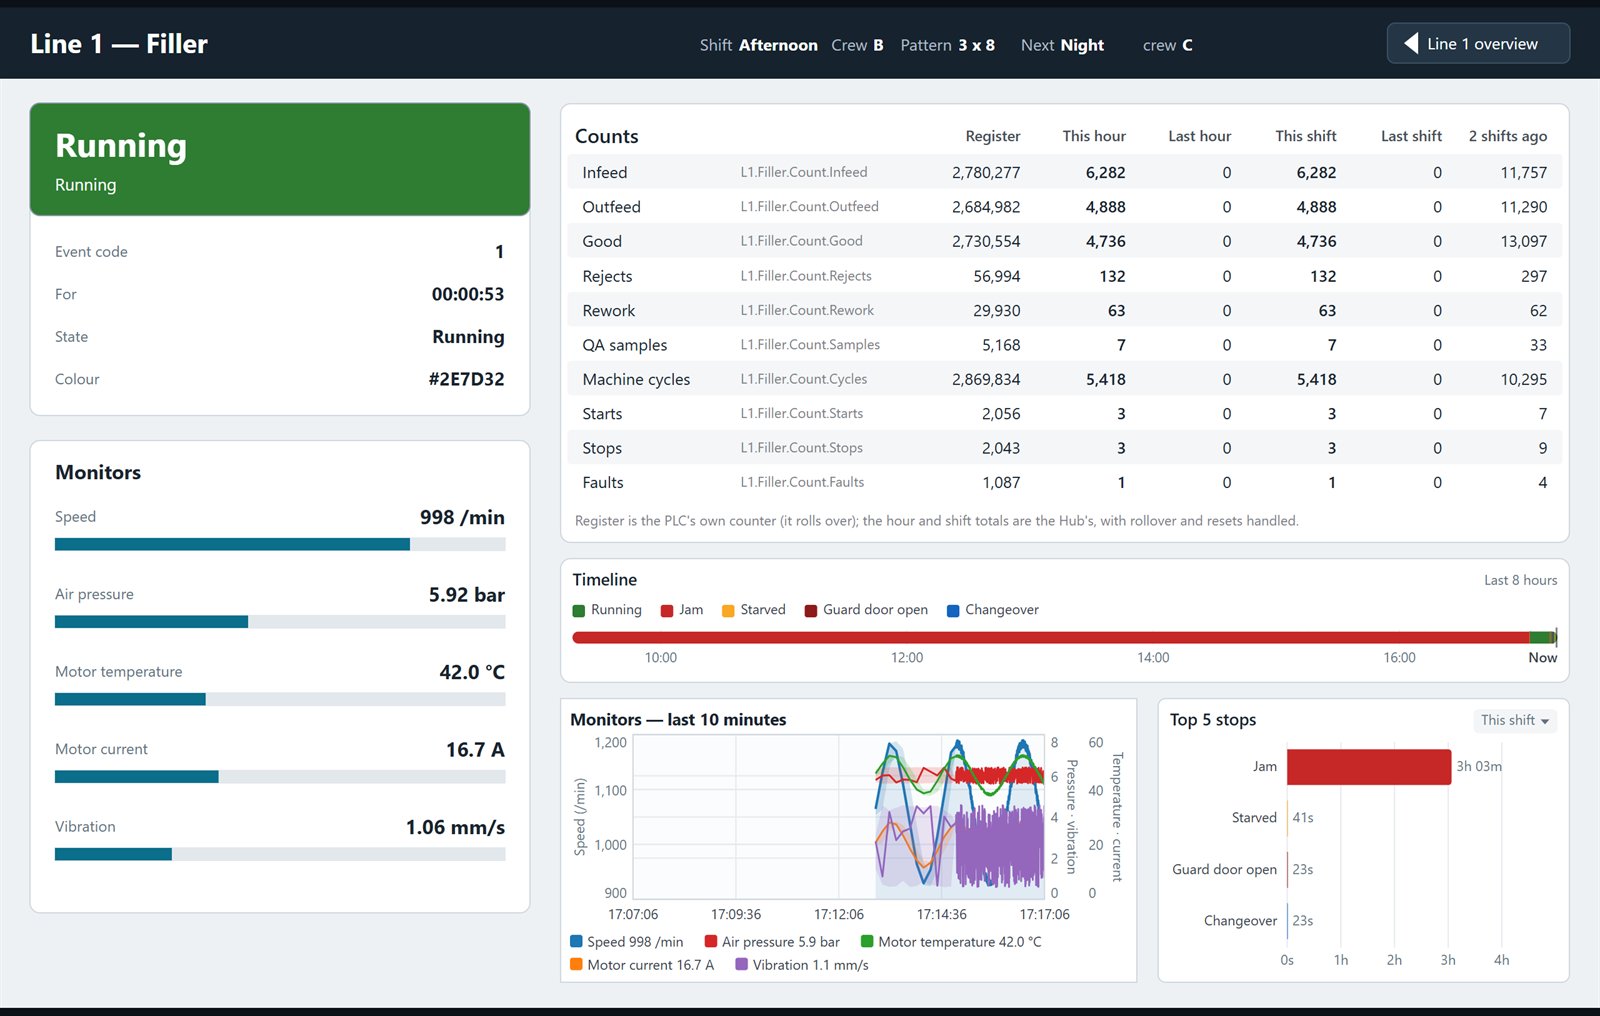
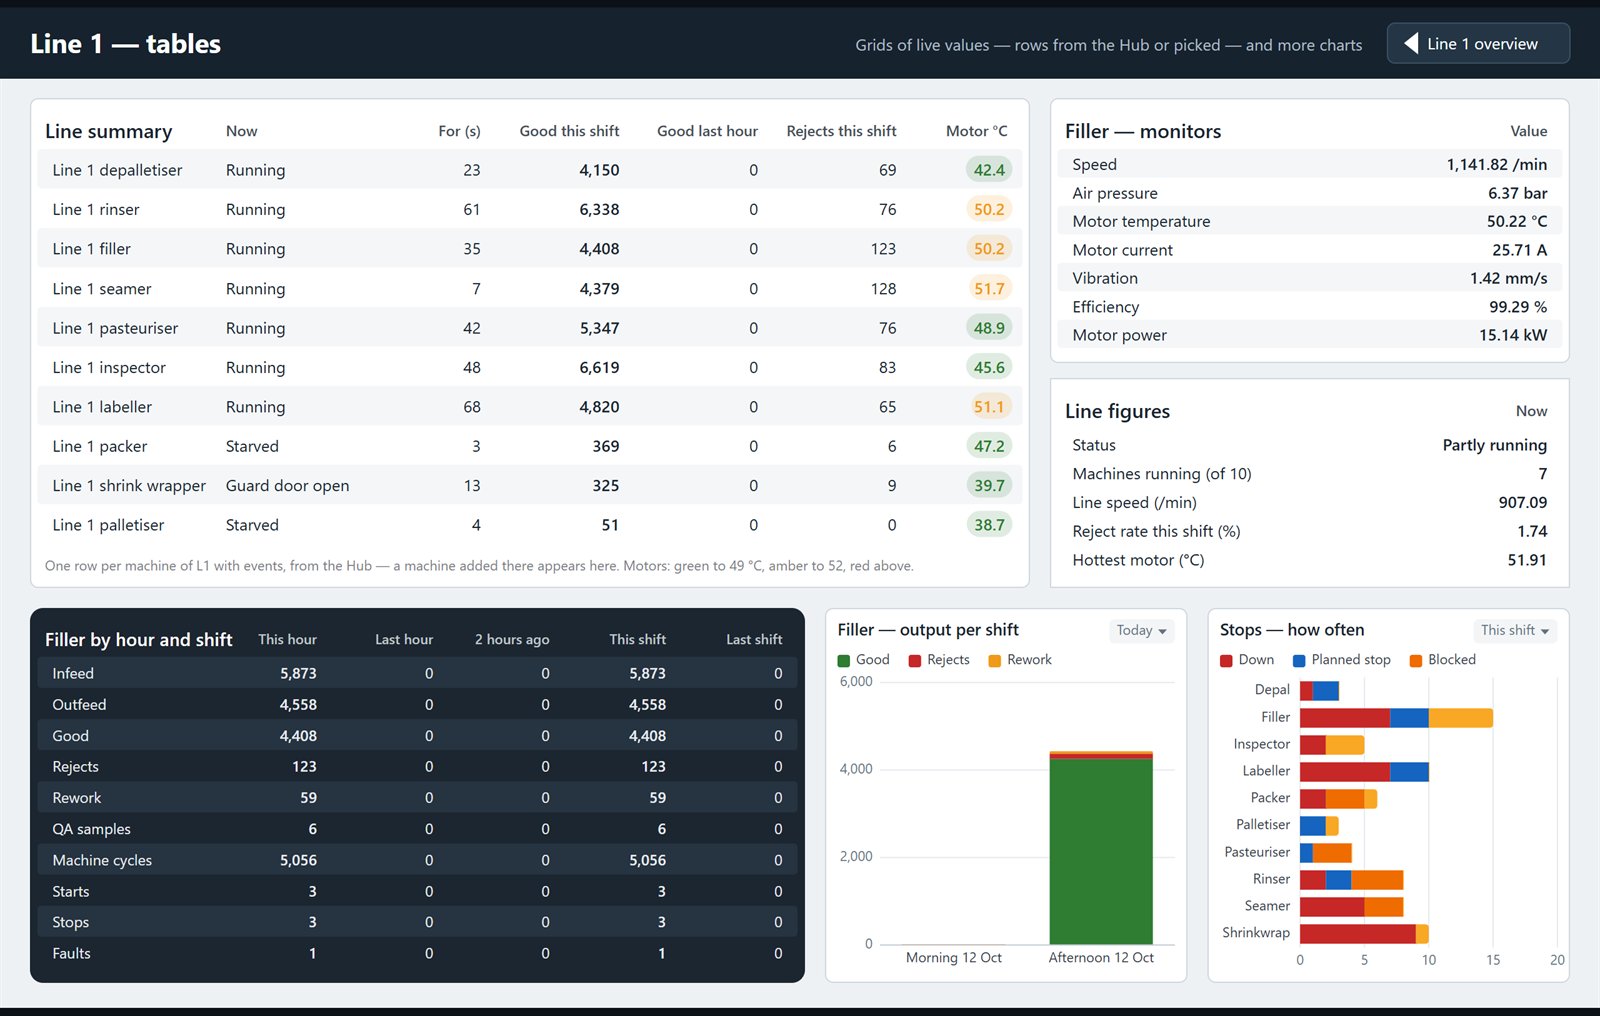
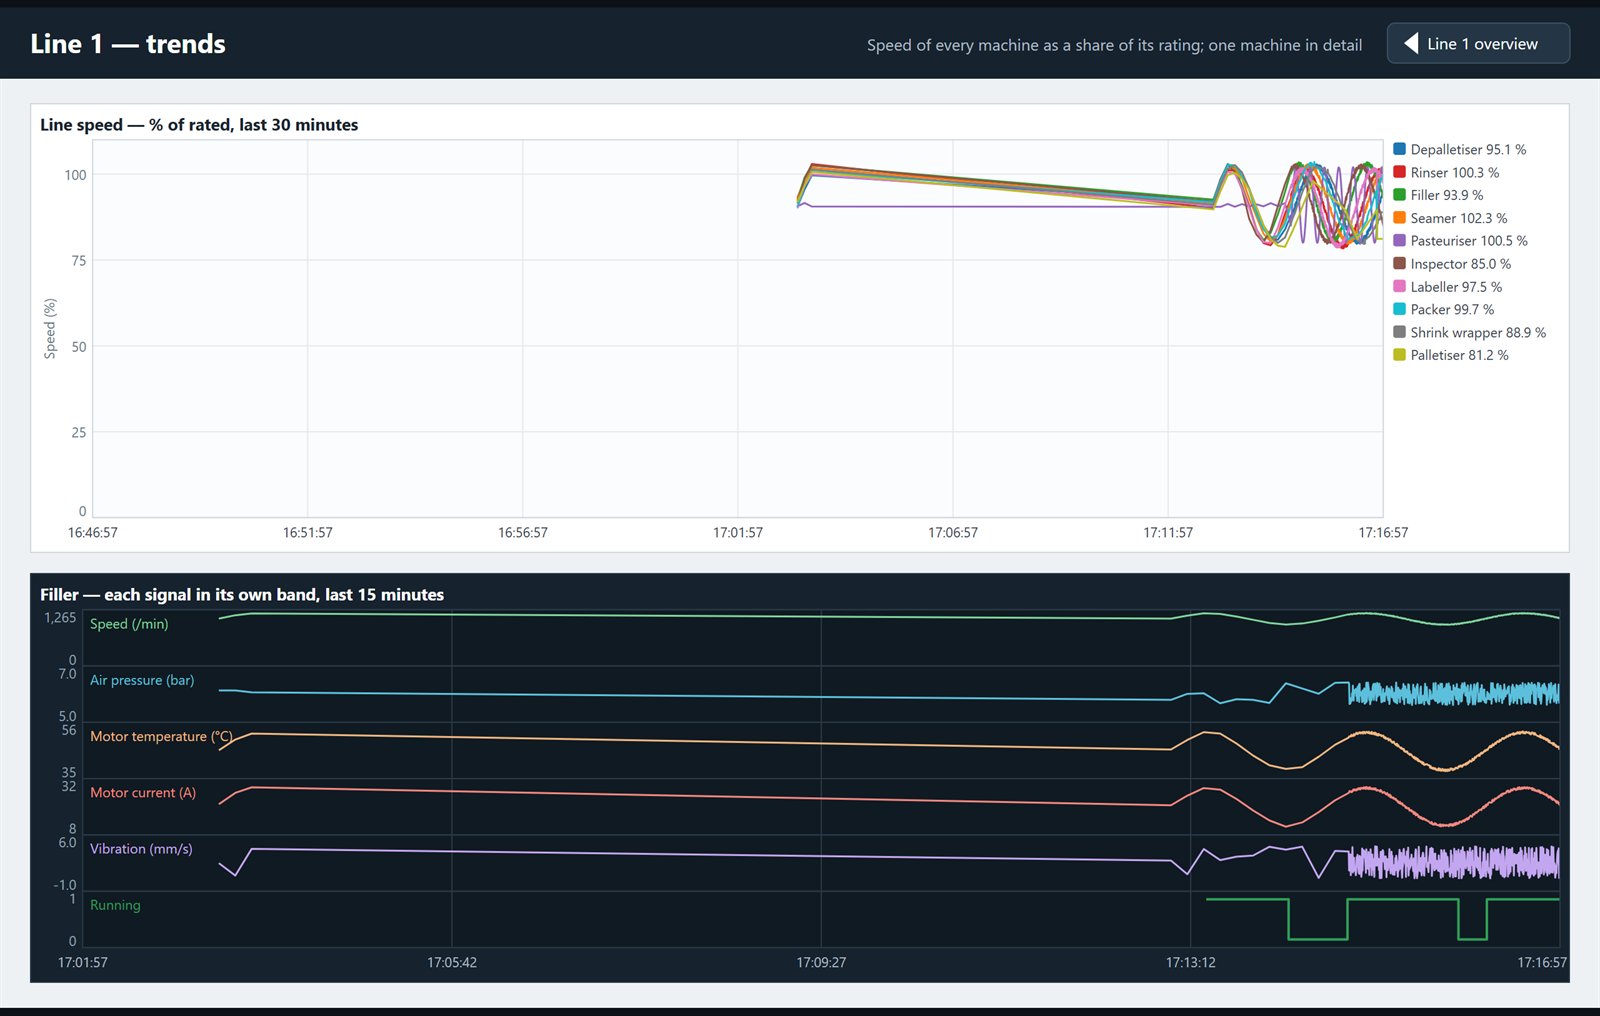
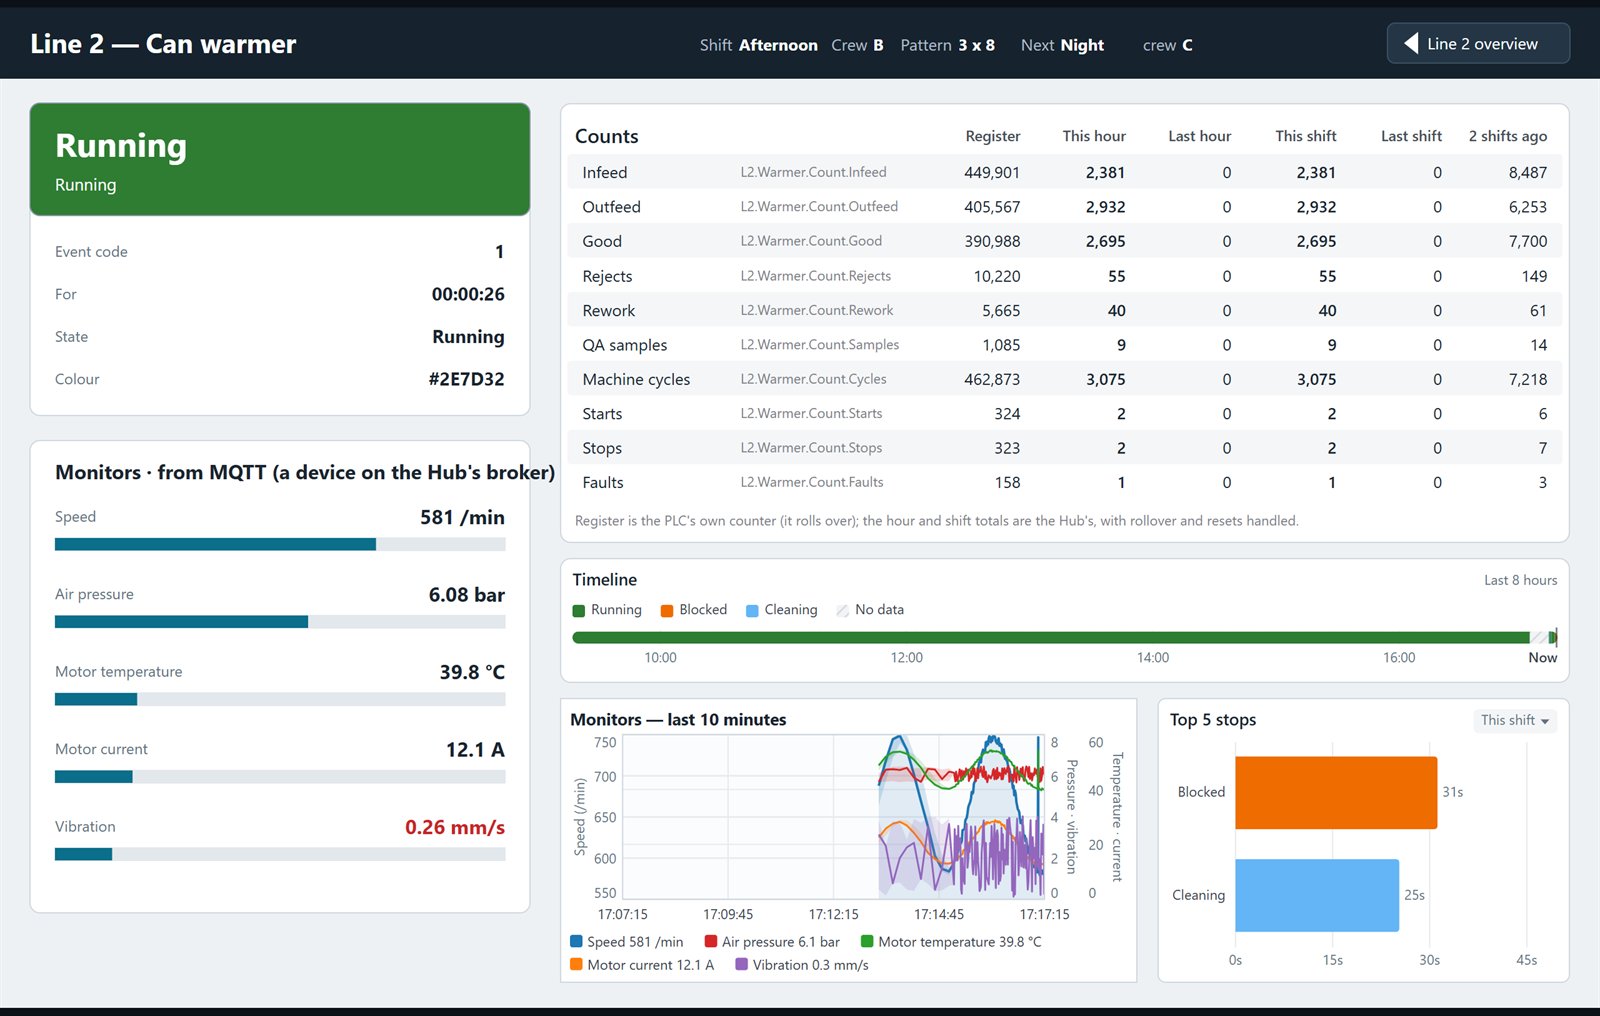
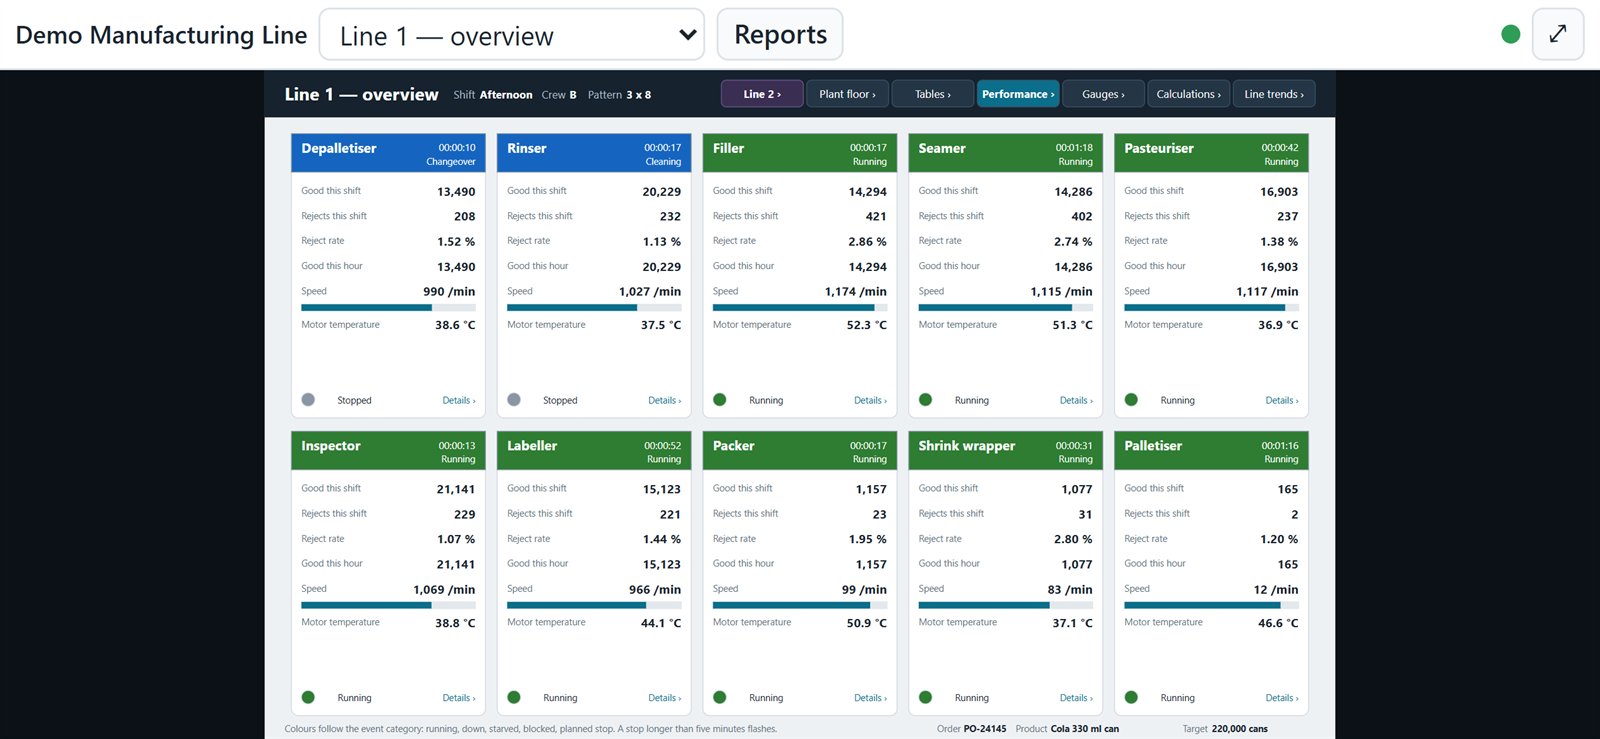
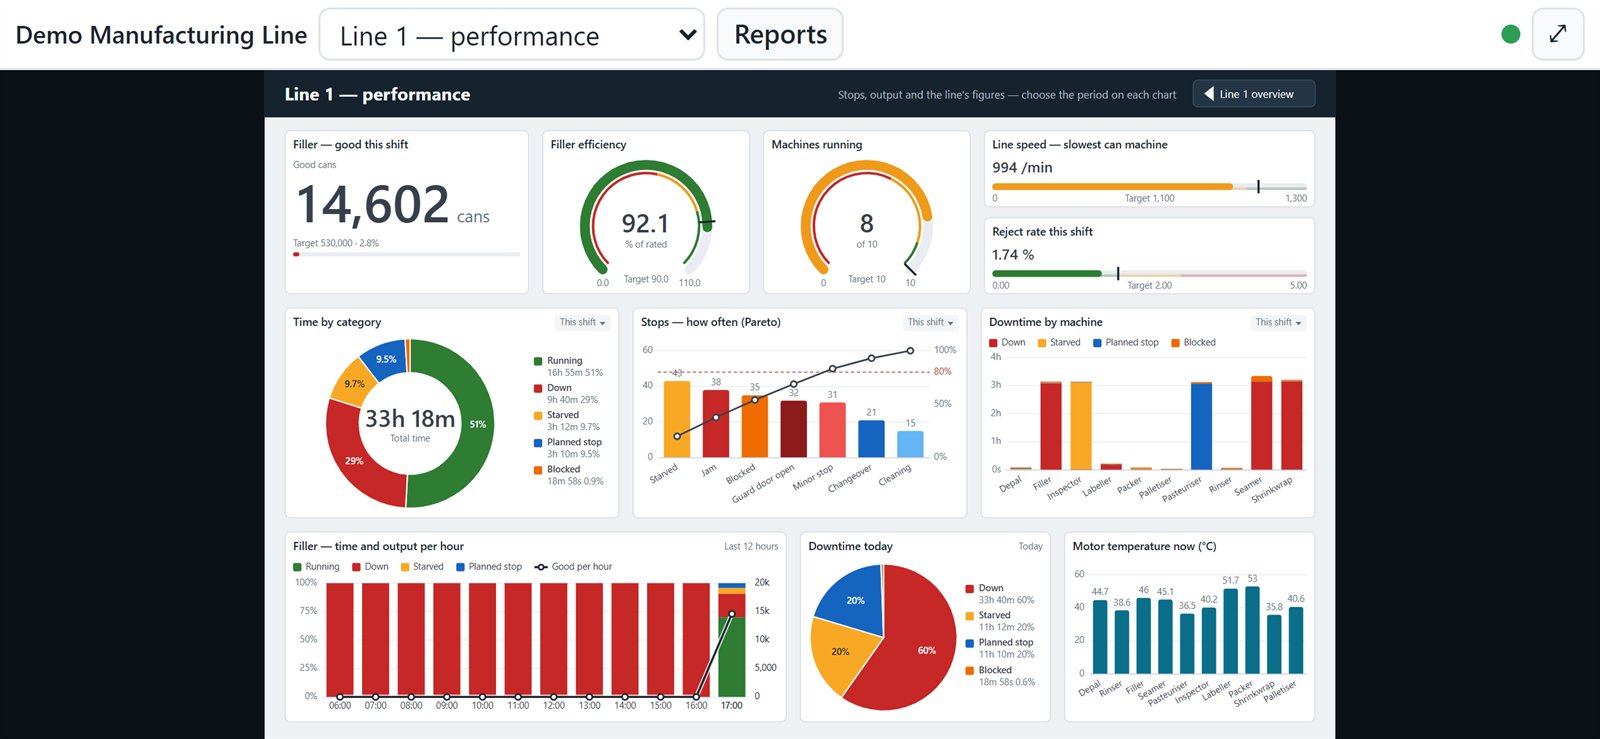
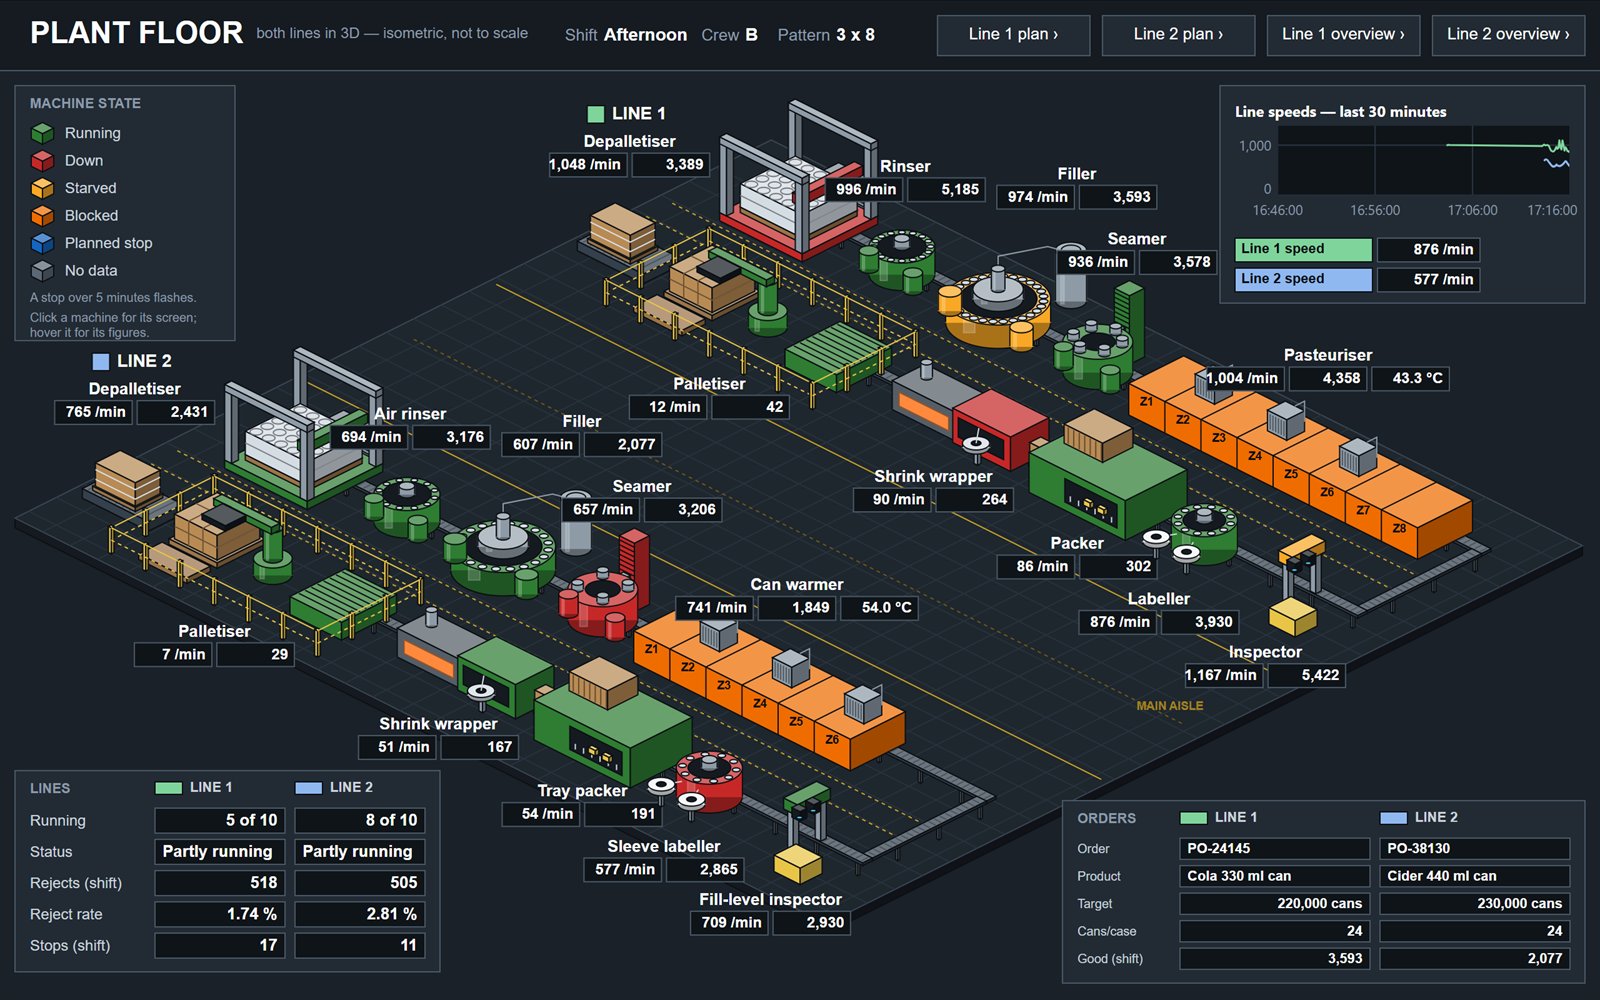
The pictures on this page come from the INCANUS demo, a simulated two-line can plant with twenty machines, running on a real Hub. Click any picture to see it full size.
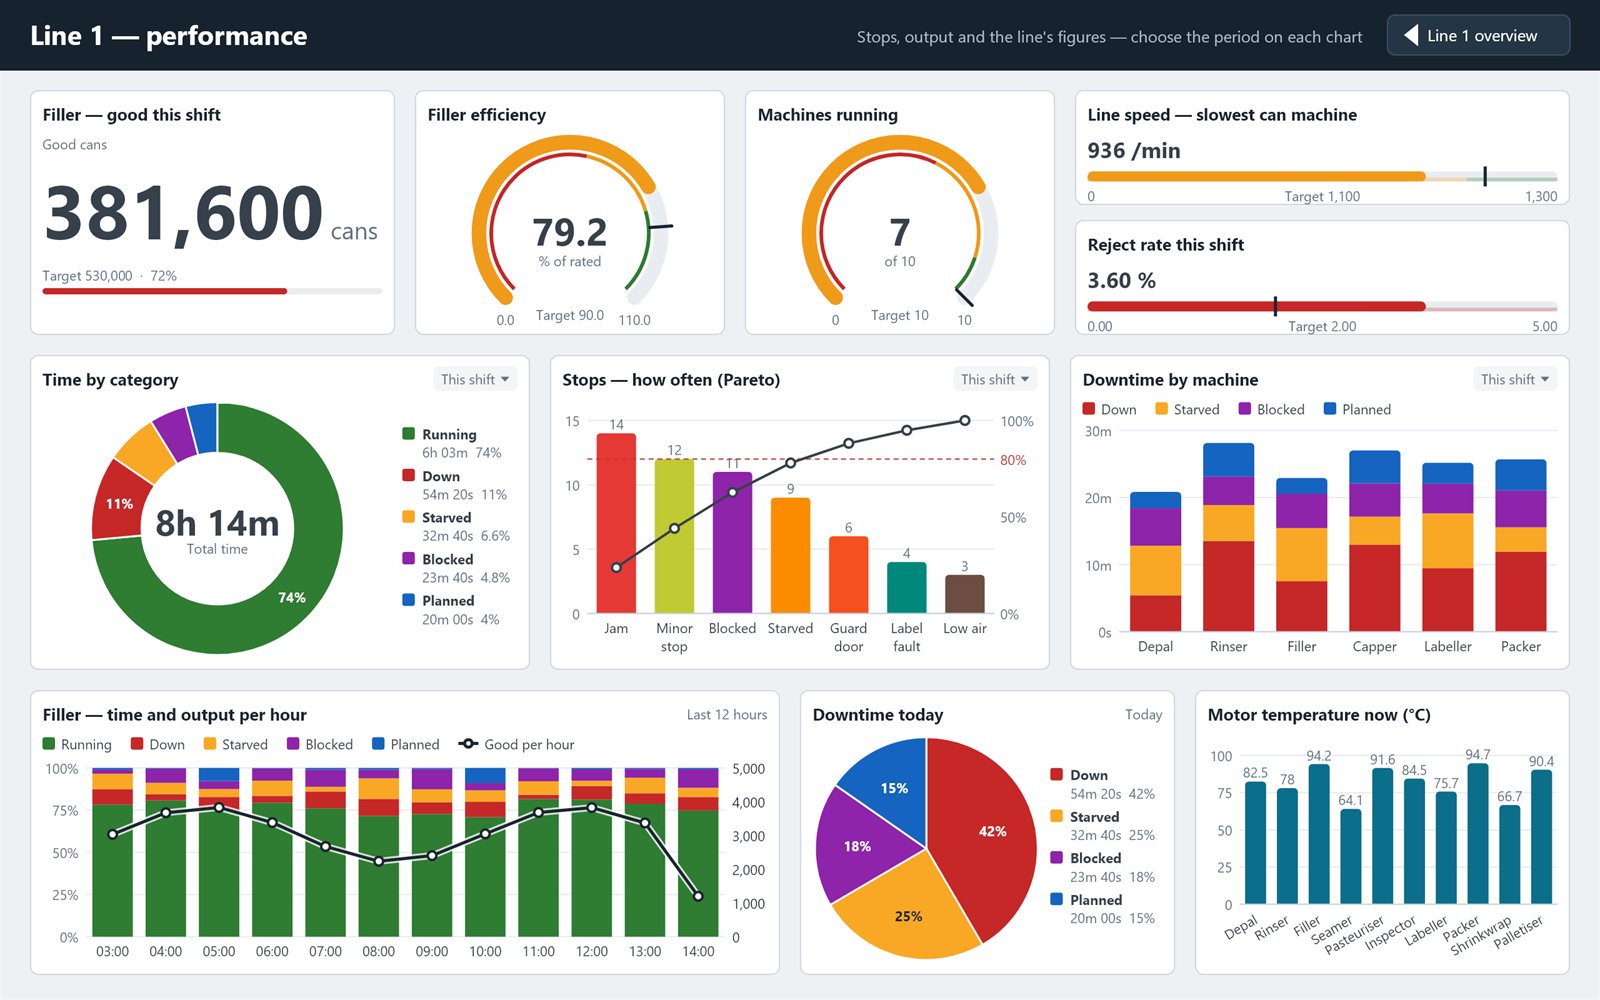
Output, efficiency and downtime on one screen. Charts read straight from the Hub's event and count history, and people looking at the screen can switch each chart's period themselves: this shift, last shift, today, this week and more.
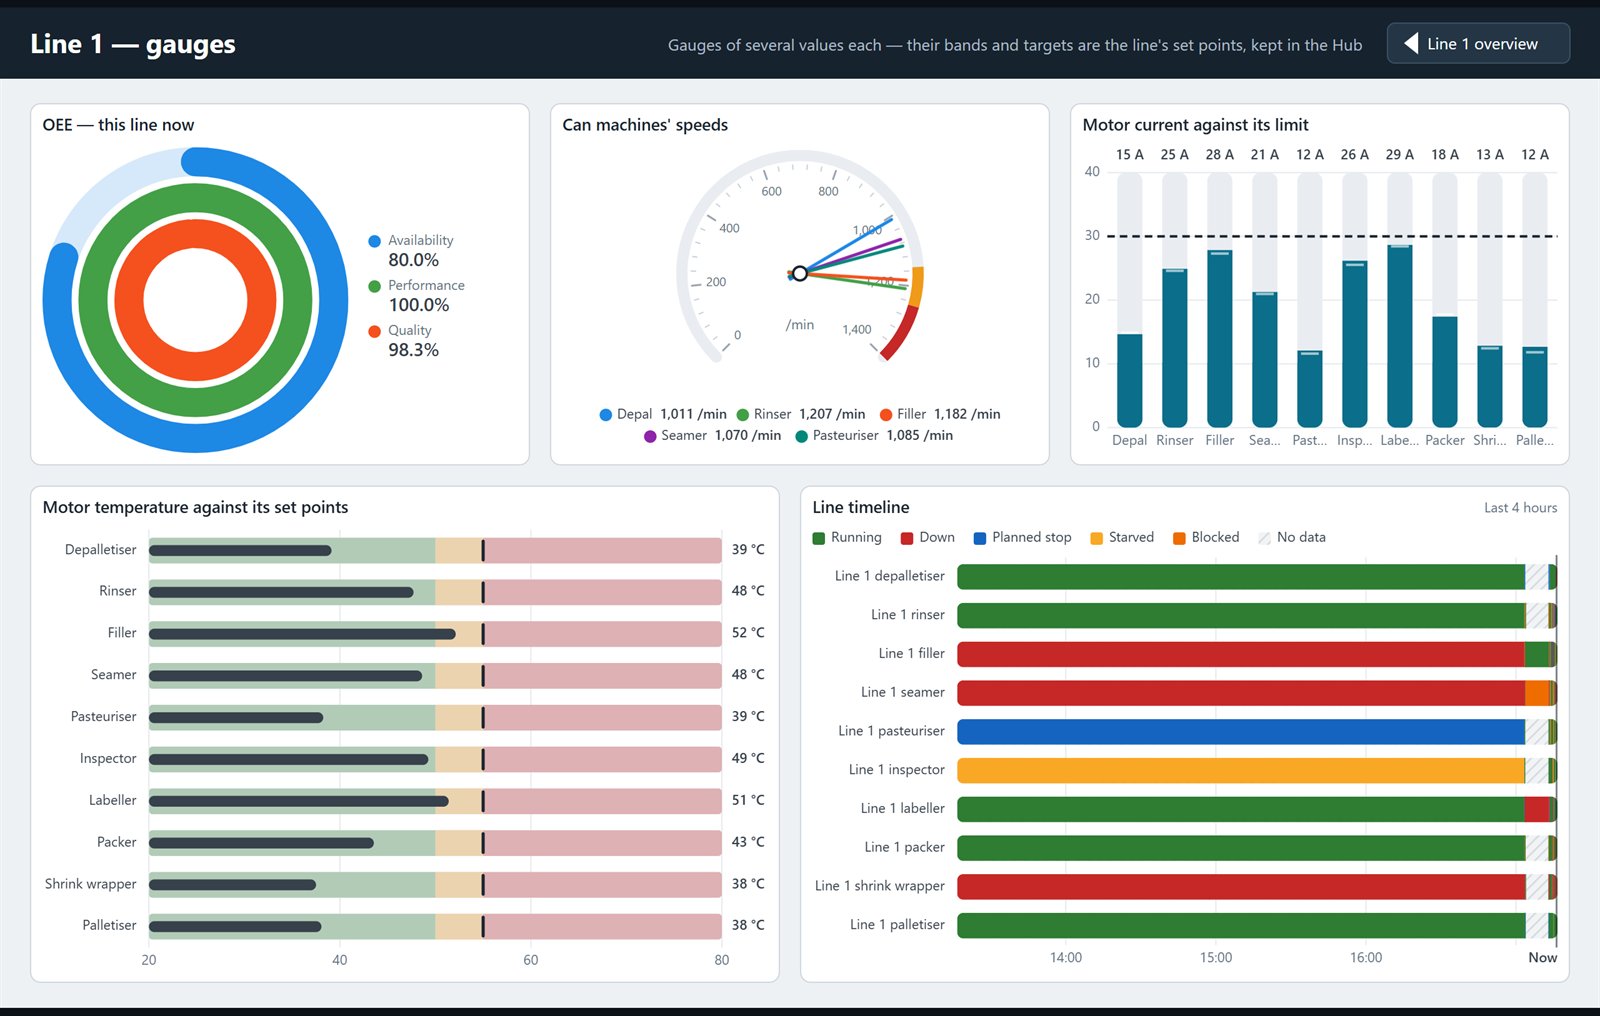
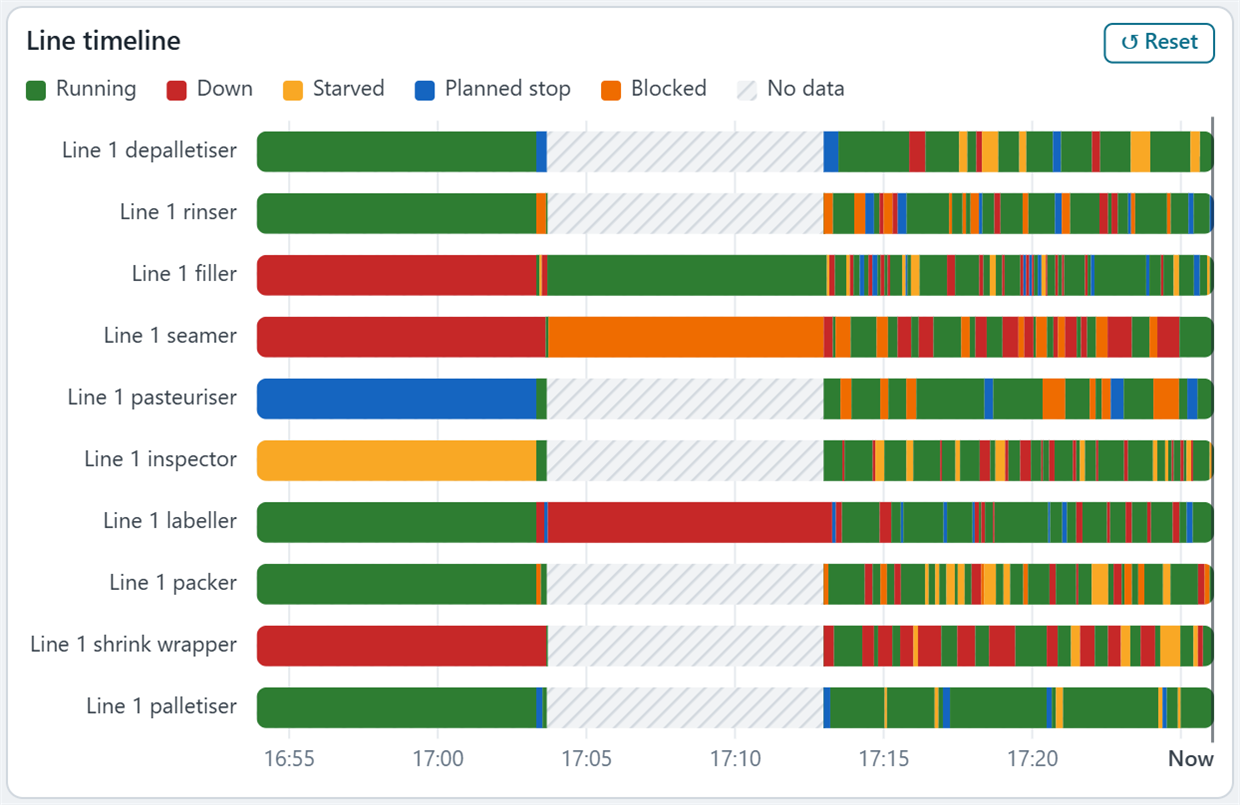
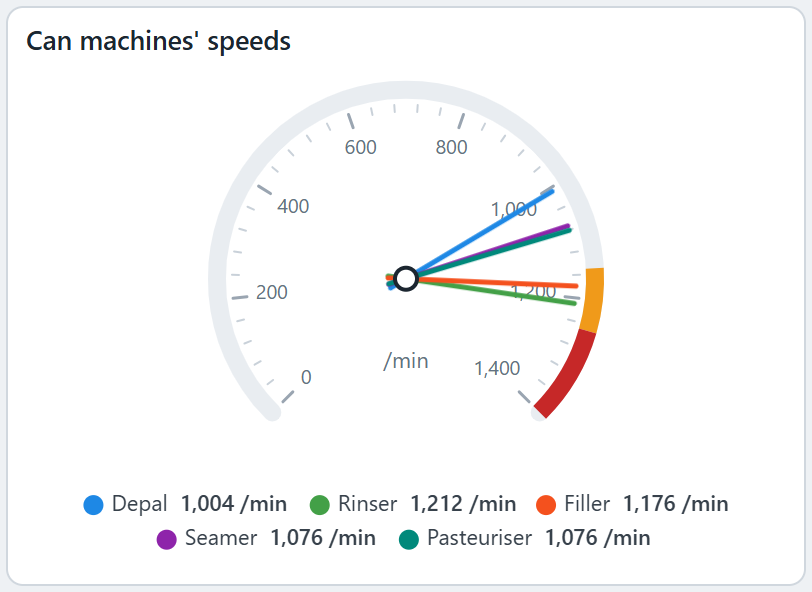
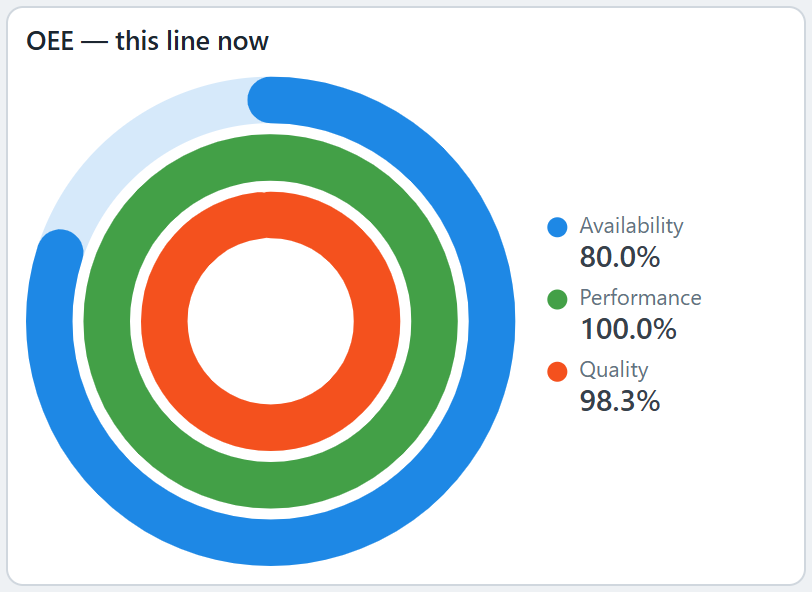
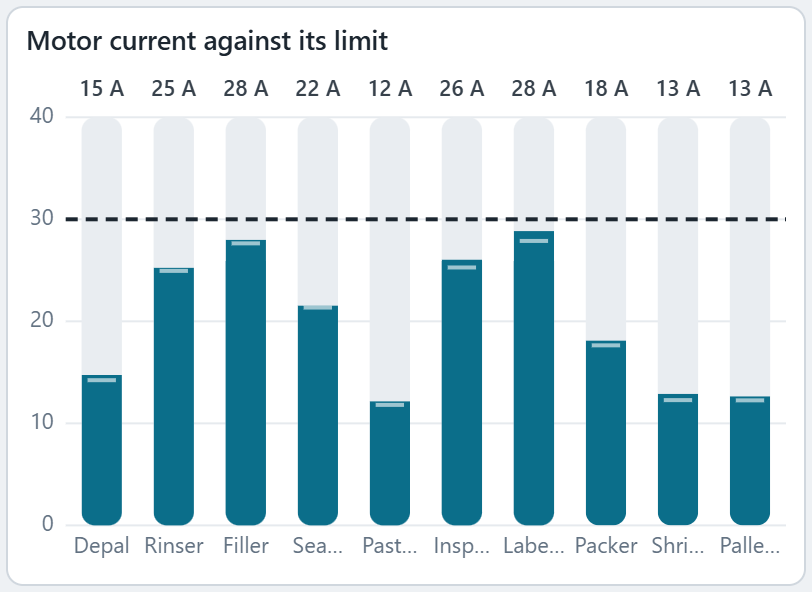
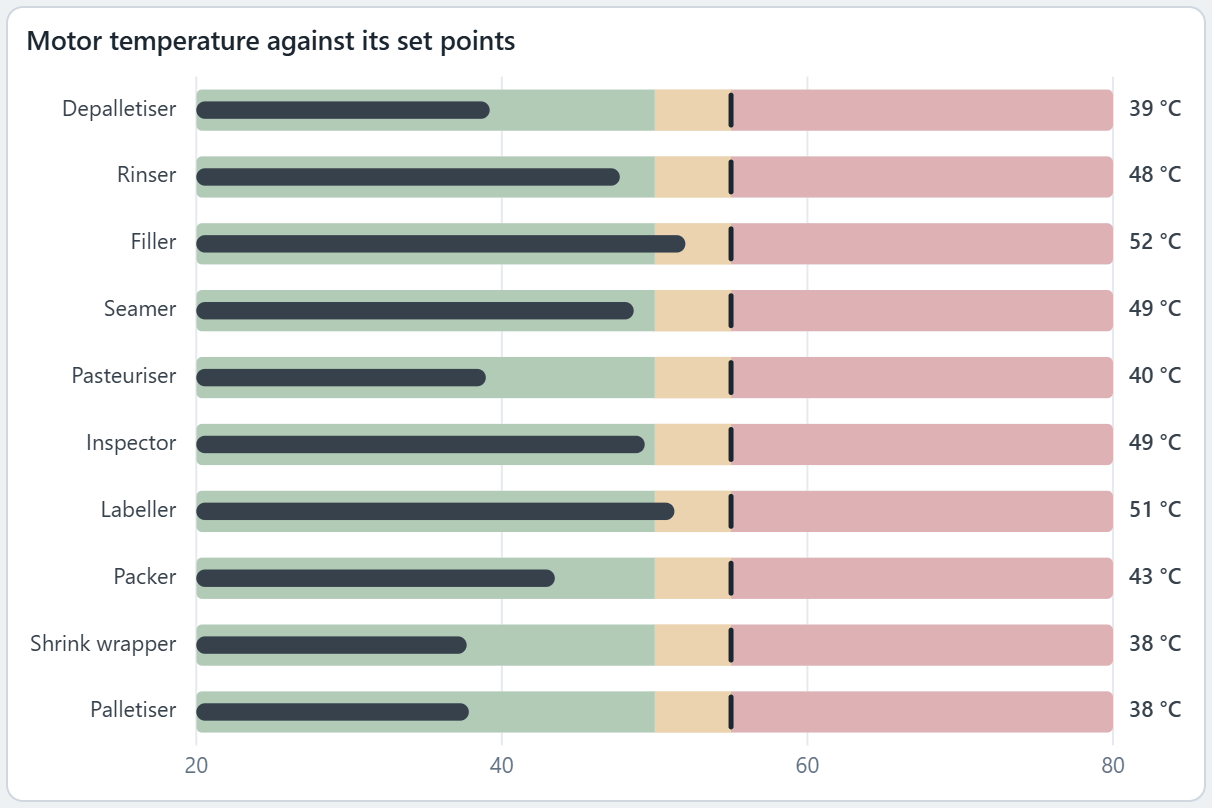
Show OEE as rings, every machine's speed on one dial, motor currents as levels against their limit, and temperatures as bullet bars against their warning and high set points. The timeline shows what every machine has been doing, block by block. Scroll the mouse wheel to zoom in, and use the Live button to go back.
// Components
Pick a component in the Designer, place it, choose its data, and it's done. Each one is set up in a single settings window with a live preview. All of these are from the demo.

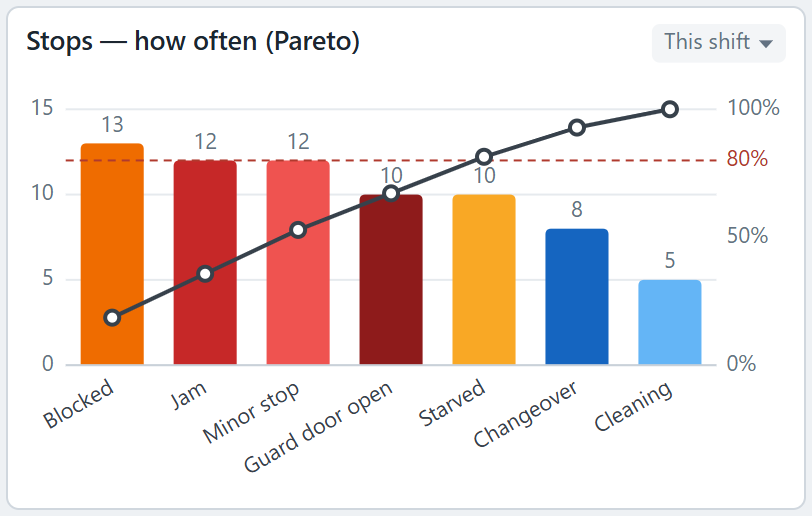
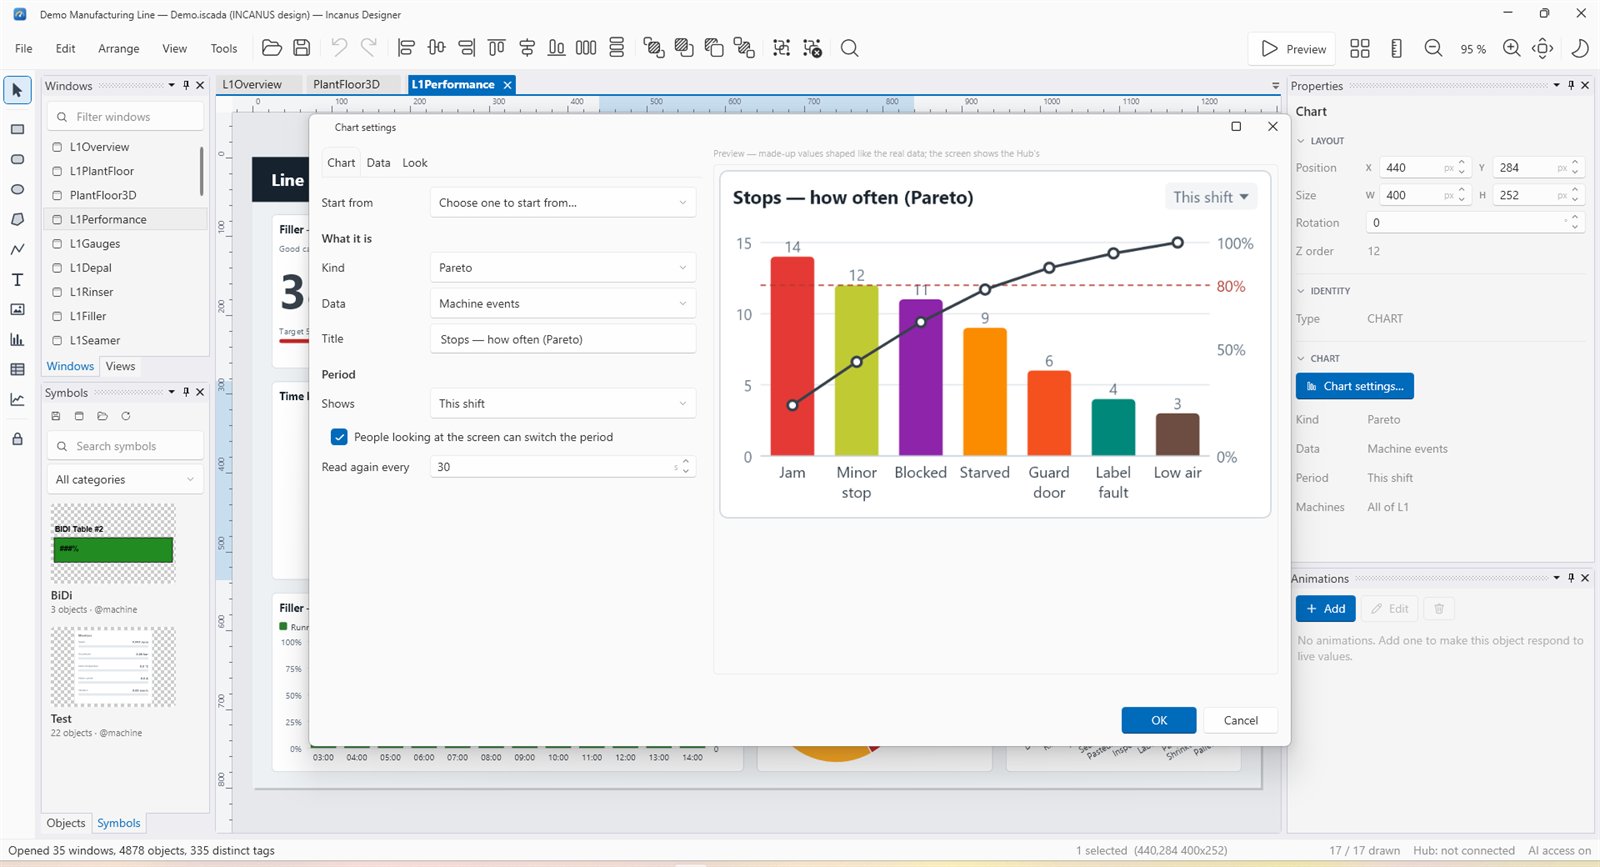
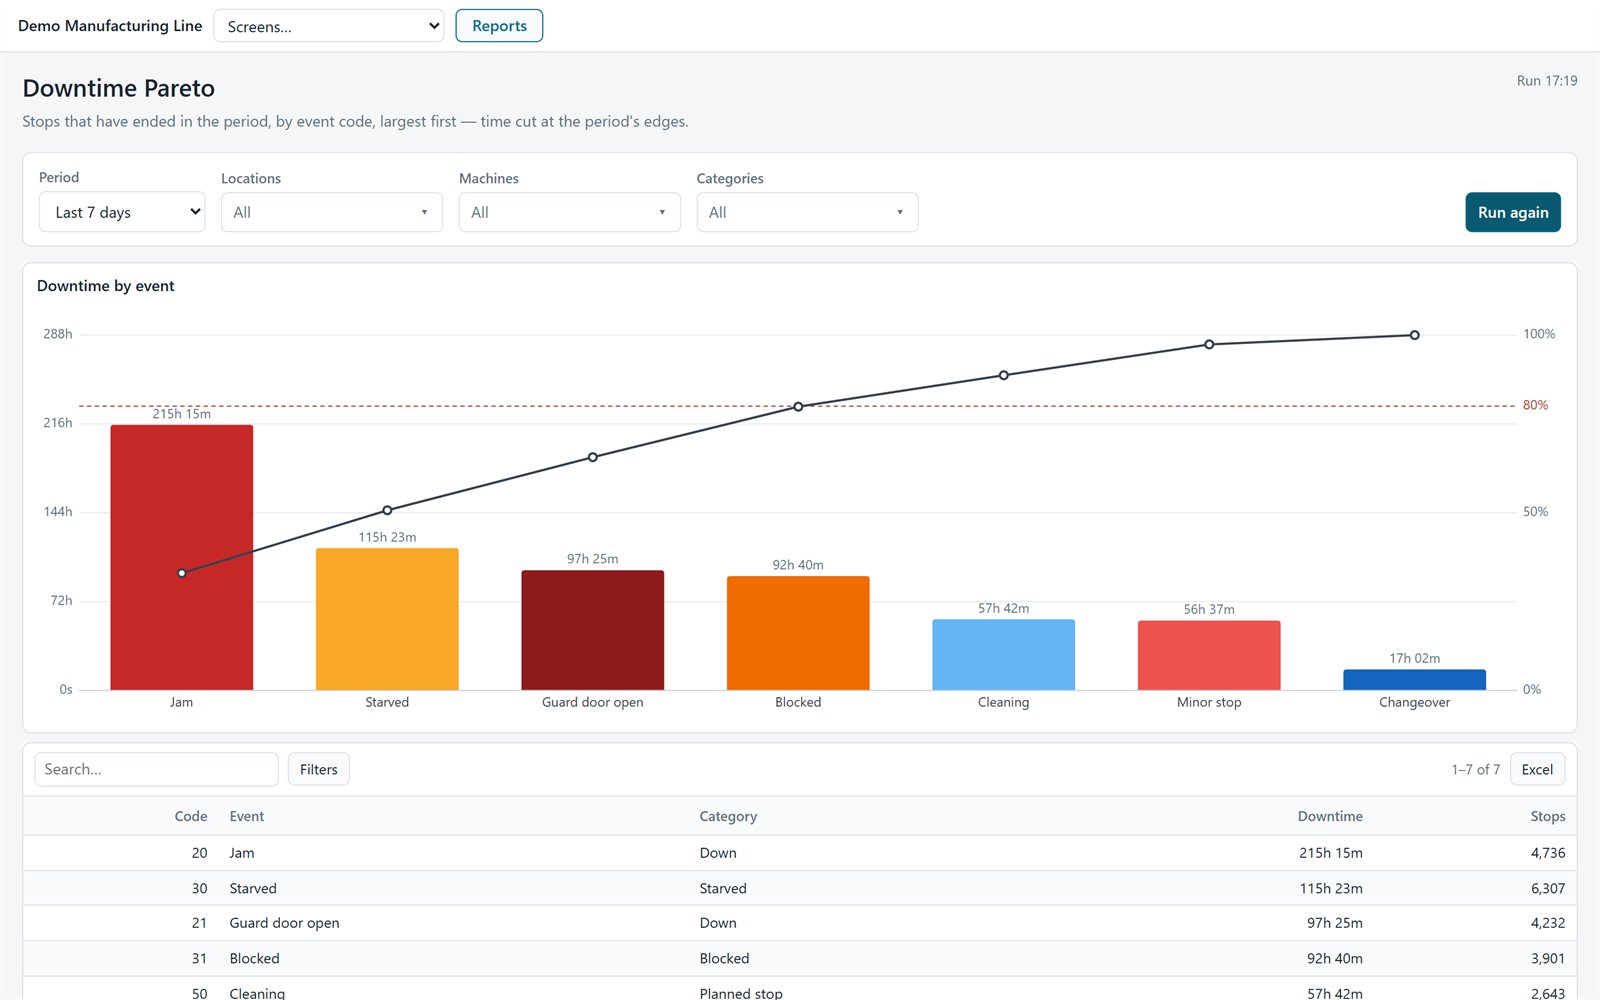
Stops largest first, with the running percentage and the 80% line.

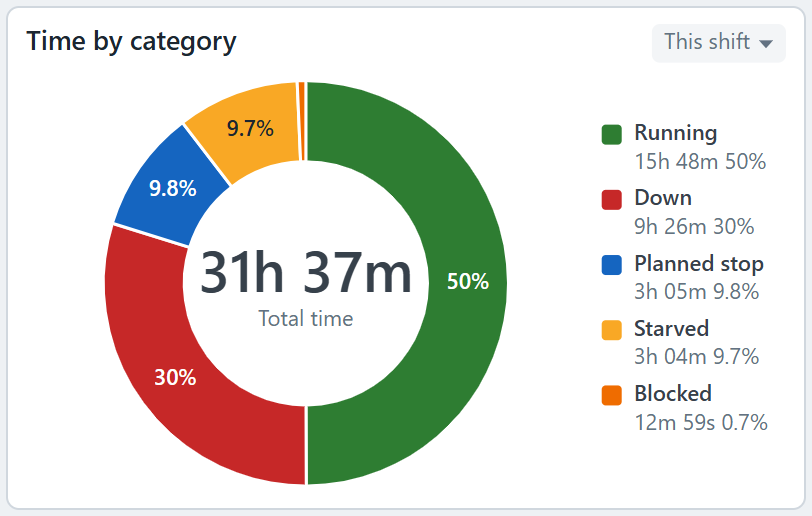
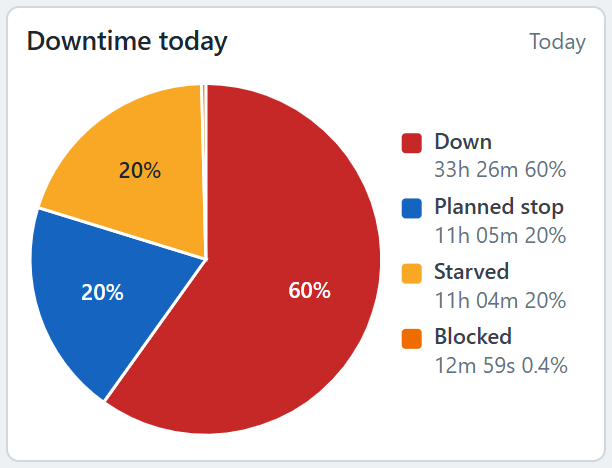
Shares of time or counts, with the total in the middle.

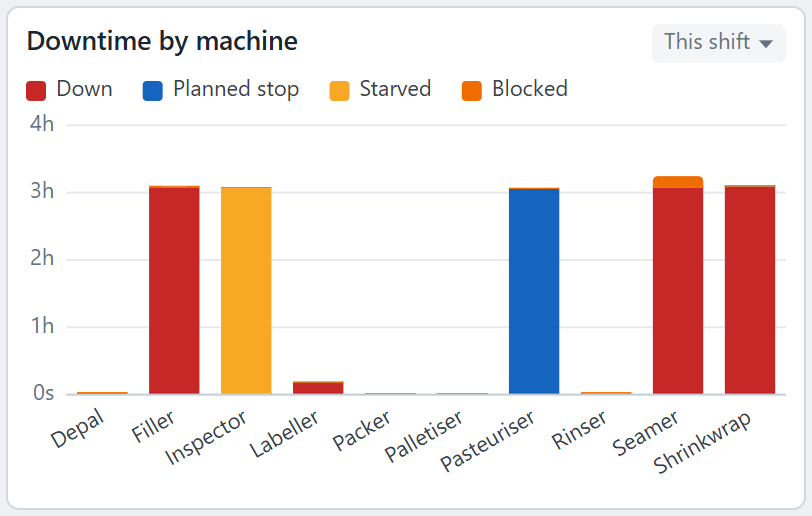
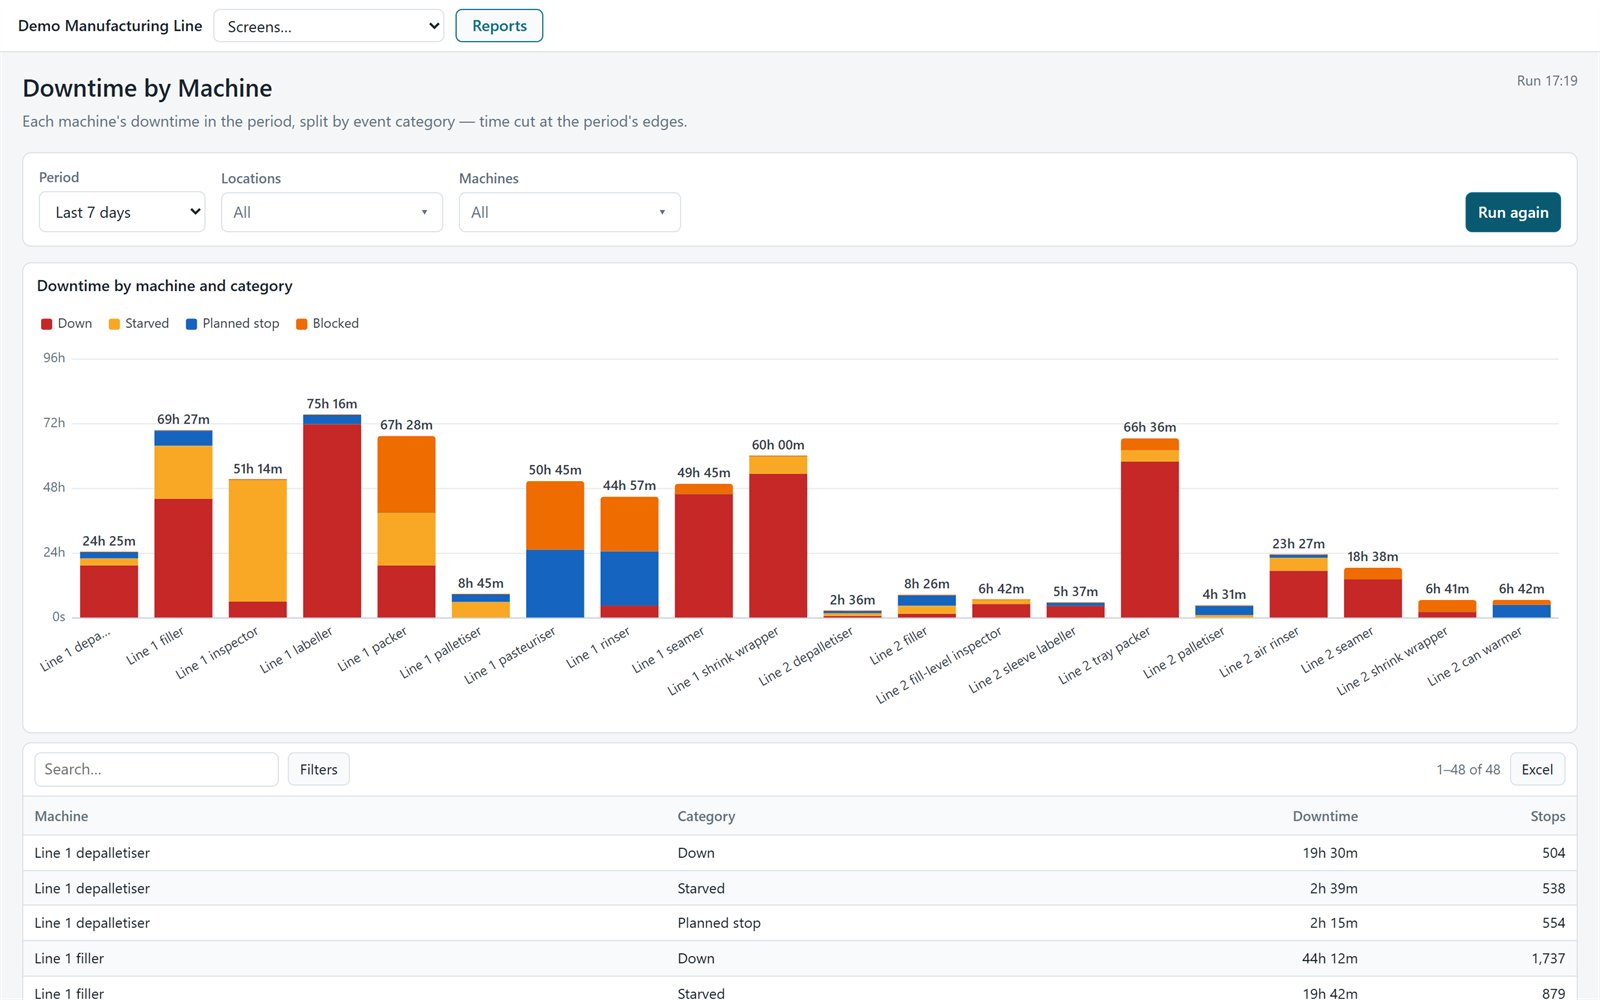
Downtime by machine, split by category or code.

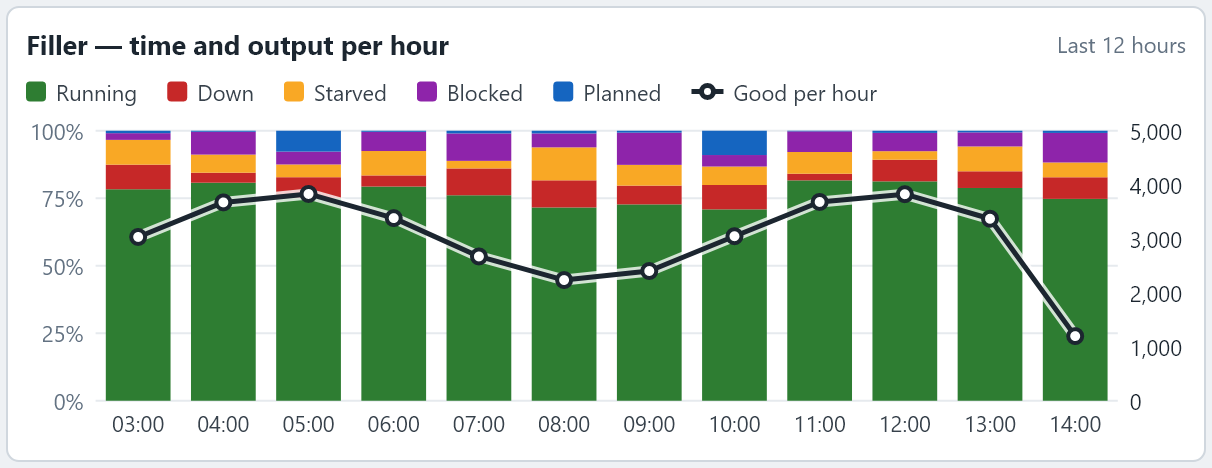
Each hour's time by state, with the output on its own axis.

Today's downtime by category.
Live values side by side, vertical or horizontal, grouped or stacked.

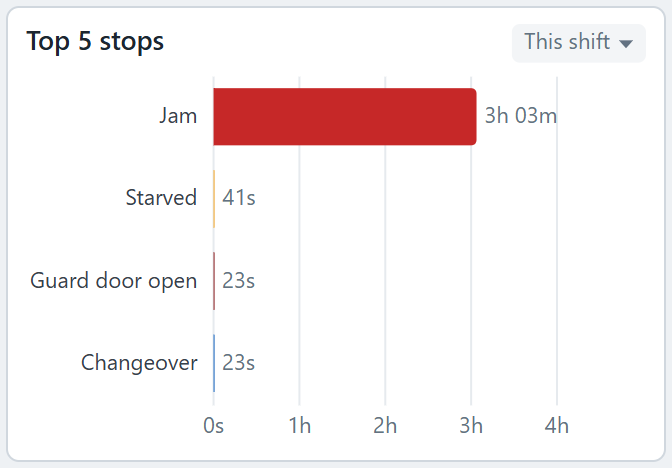
A machine's five biggest stops this shift.

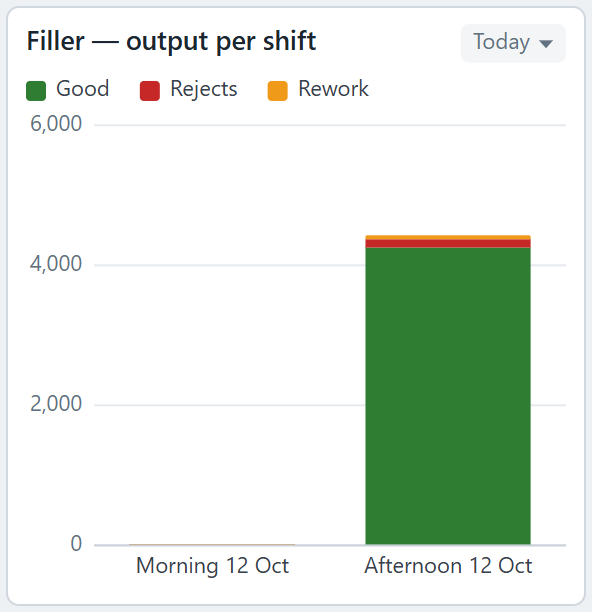
Count history by hour or shift: good, rejects, rework.

A row for each machine, with each event as a block in its colour. The current event grows as time passes. Zoom with the wheel; Live and Reset go back.

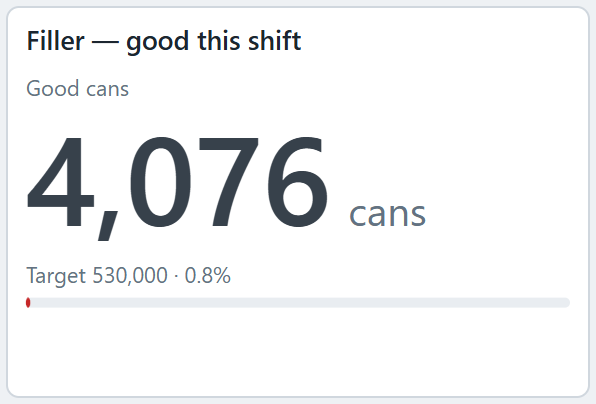
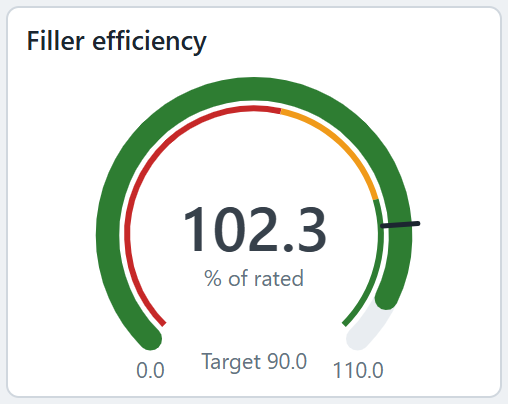
One figure, large, with progress to its target.

Value, bands and target marker.

A needle per value: every machine's speed on one face.

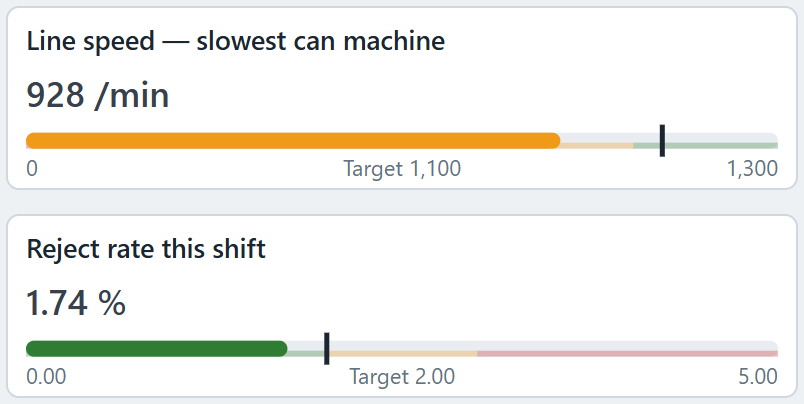
A bar against bands and a target.

Several values as rings — OEE's availability, performance and quality.
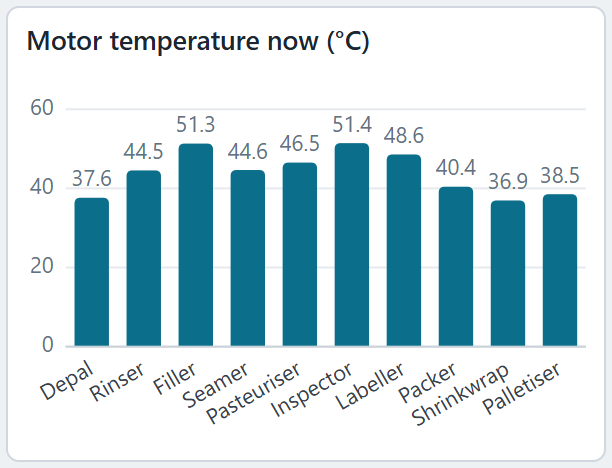
Columns against a limit line.
A row per value against warning and high set points kept in the Hub.

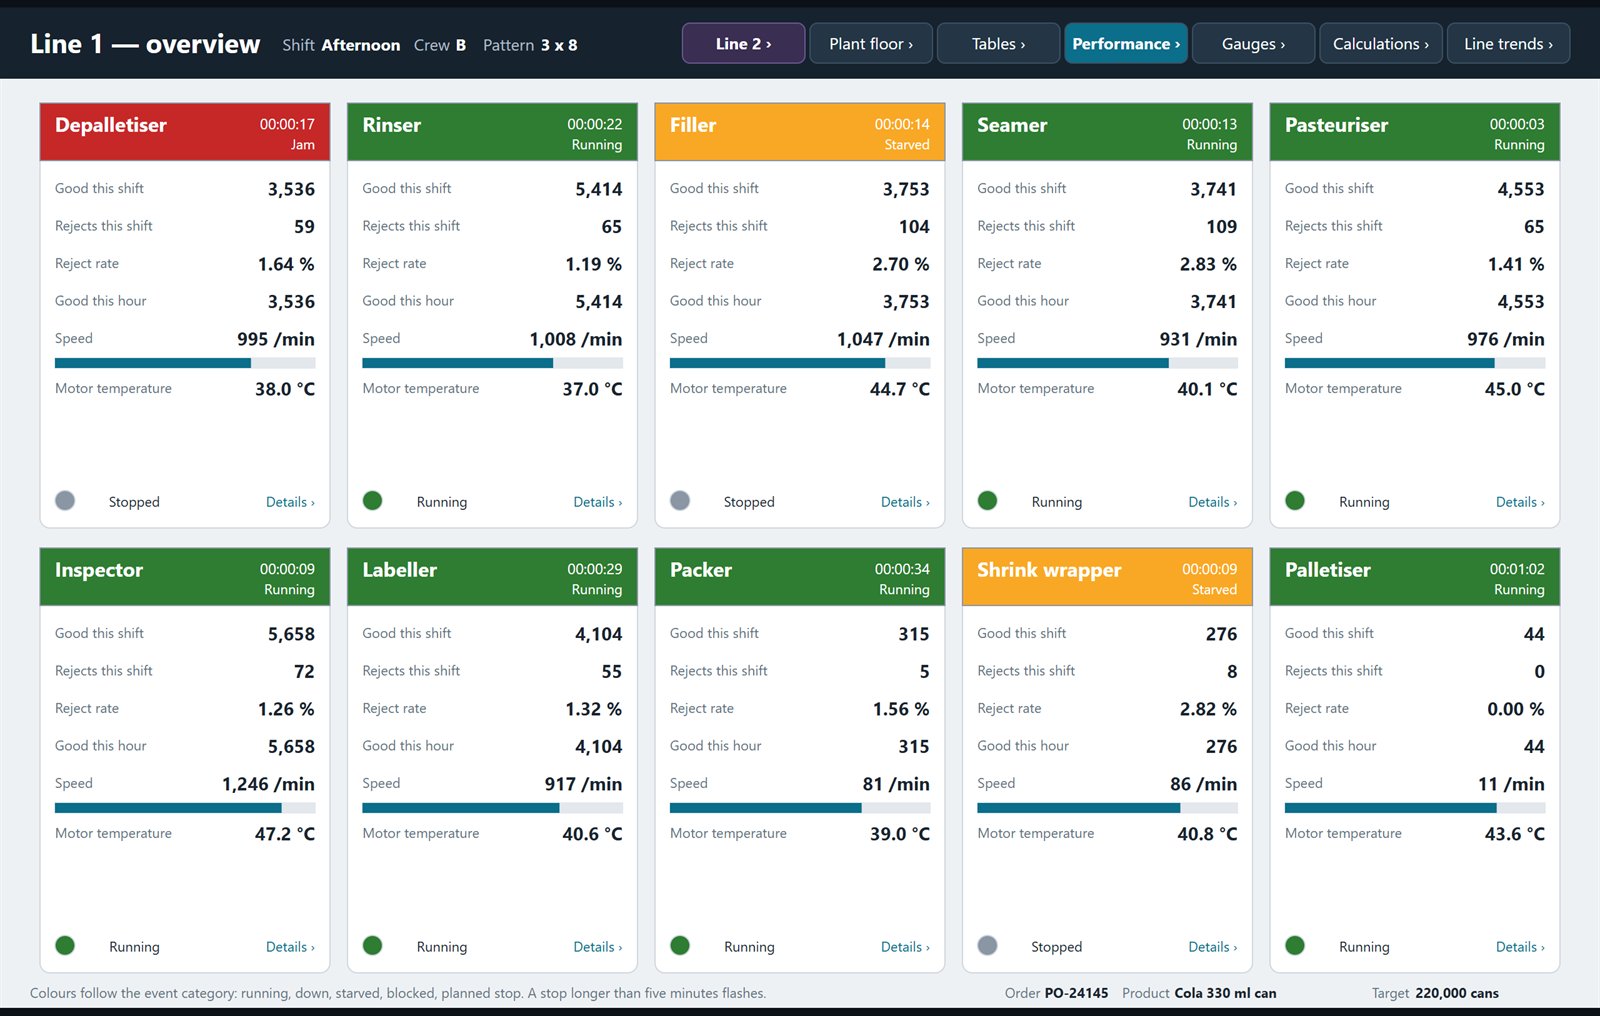
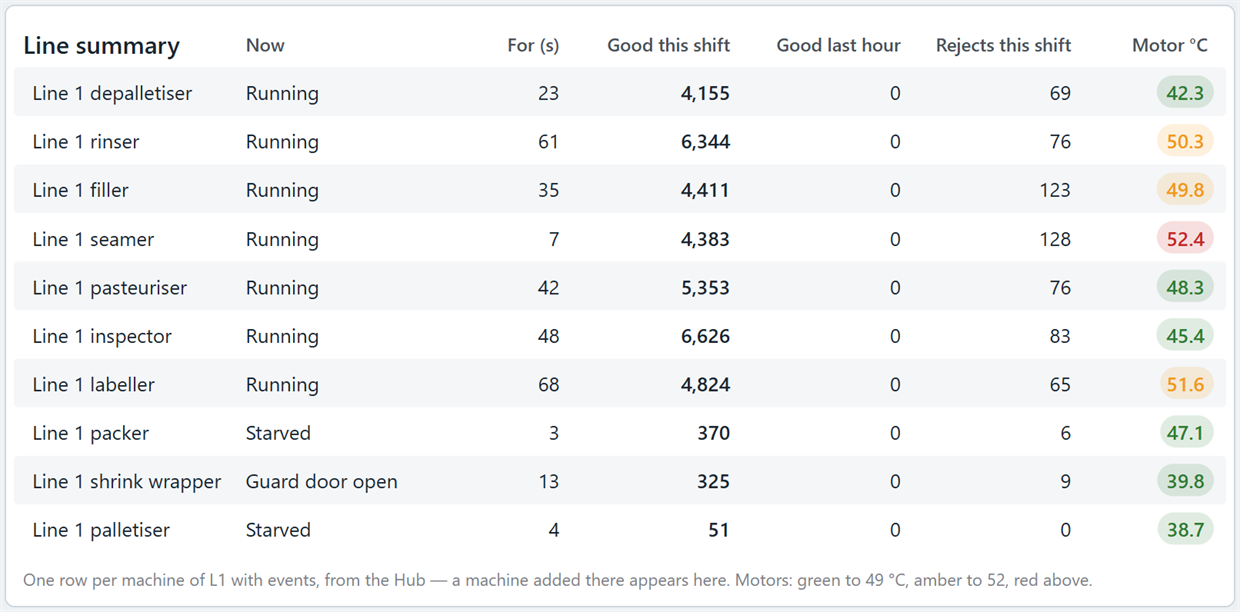
A row per machine at a location, filled in by the Hub. Add a machine there and it appears. Colour bands mark limits.

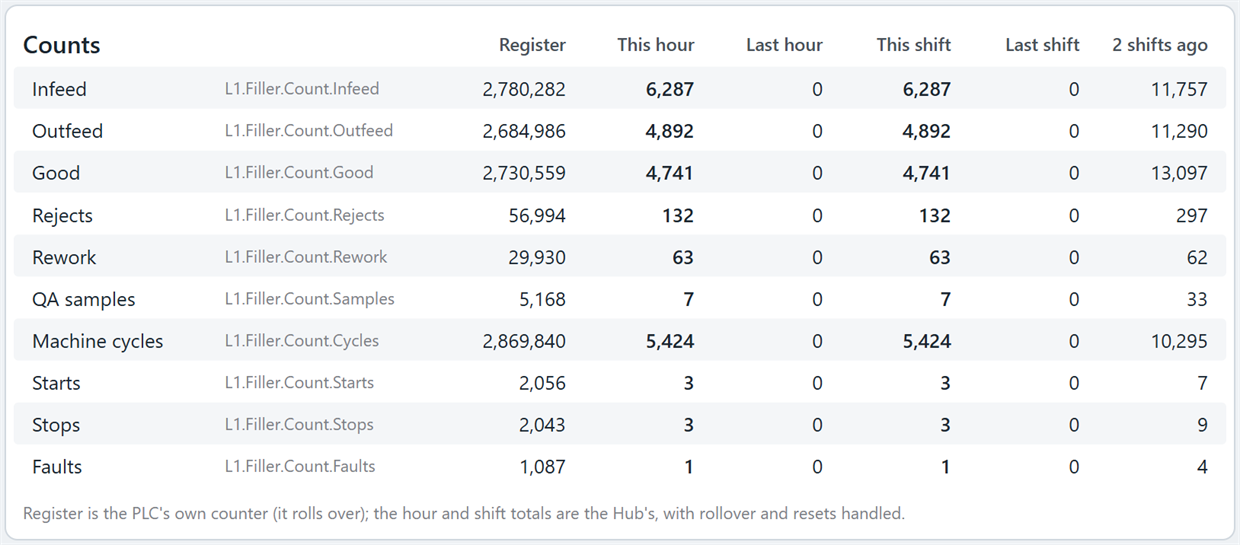
A machine's counts: the PLC register, this hour, last hour, this shift and the shifts before.

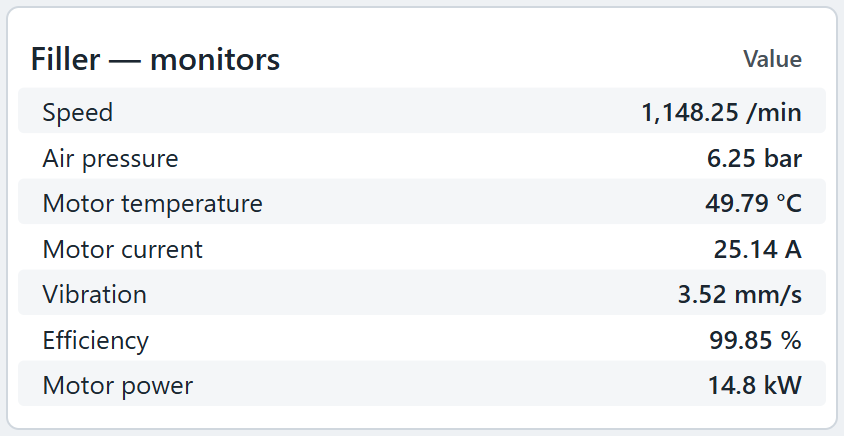
Every measurement on a machine, with units.

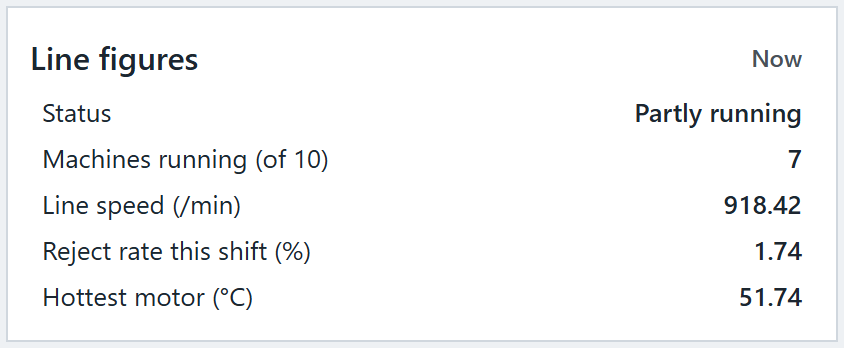
Any tags, as a tidy table of figures.

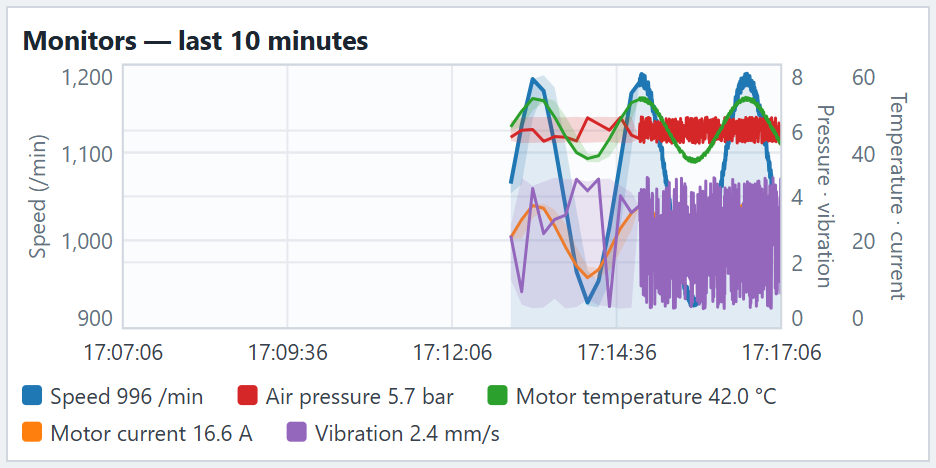
Several pens and axes, with a min/max envelope, hover readout, zoom and pan.
Rectangles, rounded rectangles, ellipses, polygons, lines, text, images and groups. Any of them can be bound to live values:
// Incanus Designer
A modern Windows application for building screens, with light and dark themes and panels you can arrange. It connects to the Hub for its tag list, so tag names complete as you type and you can preview with live values.
Double-click a chart, grid or trend to open its settings, with a preview that changes as you do.
// Connectivity
The Hub reads from your PLCs and systems and never writes back to them. Every value it produces is published on its own MQTT broker and stored in your database.
// Data & reports
History is laid out as time series, with minute, hour and shift summaries written as it goes, so the large queries are already done when someone asks. You choose the database.
For sites that already run it, with backups and access handled the usual way.
A good fit where MySQL or MariaDB is already the standard.
No database server needed: a single file beside the Hub, ideal for a single line or a trial.
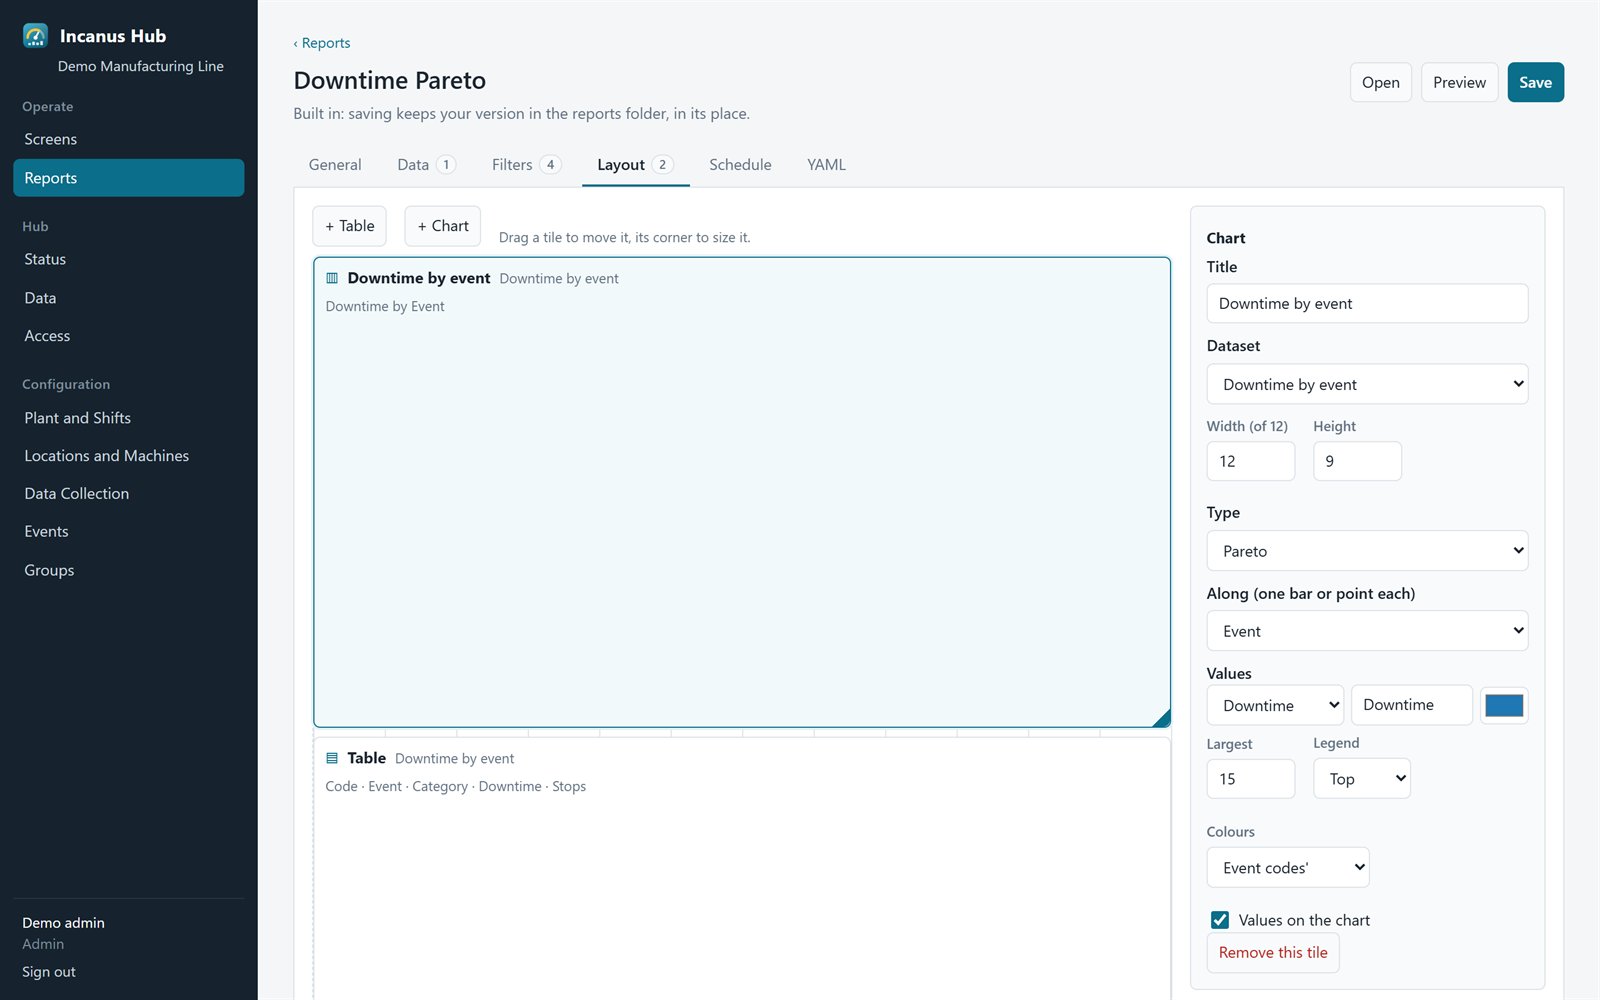
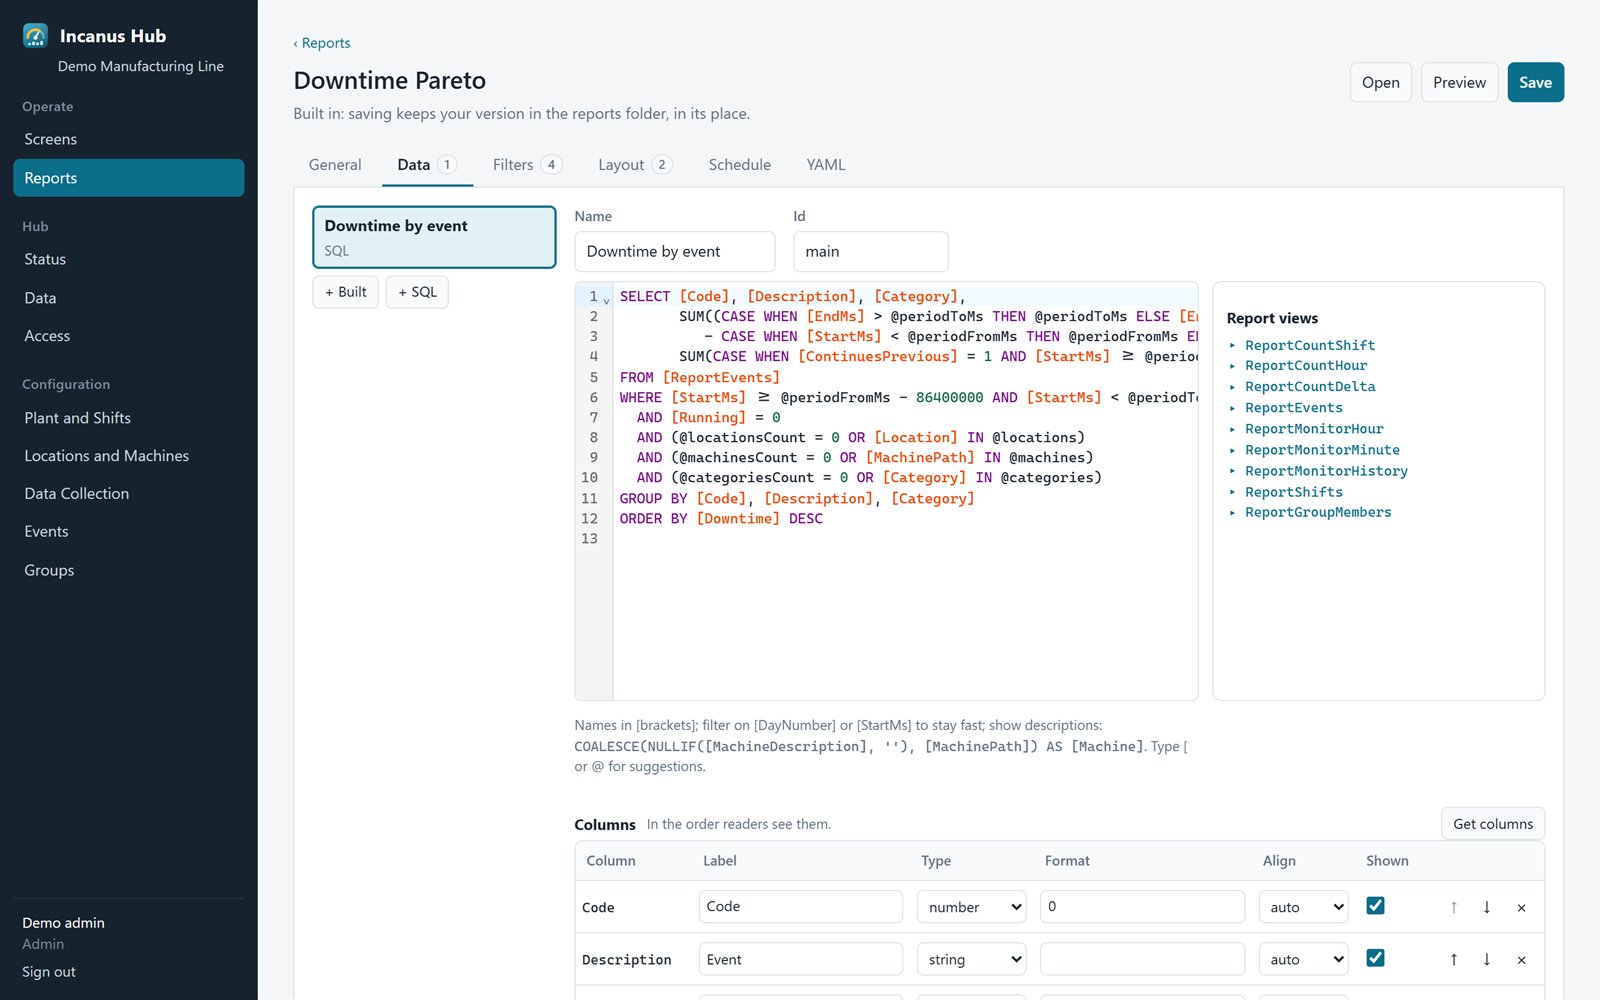
Ten reports are included out of the box: downtime, Pareto, output, shifts, crews and more. Each has a chart and a table, filters for period, location, machine and category, searching and sorting, and one-click Excel export.
Build a report by choosing its source, fields, totals and filters, with no SQL needed. Or open the SQL editor, which has syntax highlighting and suggestions for the report views. Then lay out the charts and tables by dragging, and set a schedule.
Reports are plain files on the Hub, so they're easy to back up, copy between sites and keep under control.
// Incanus Hub
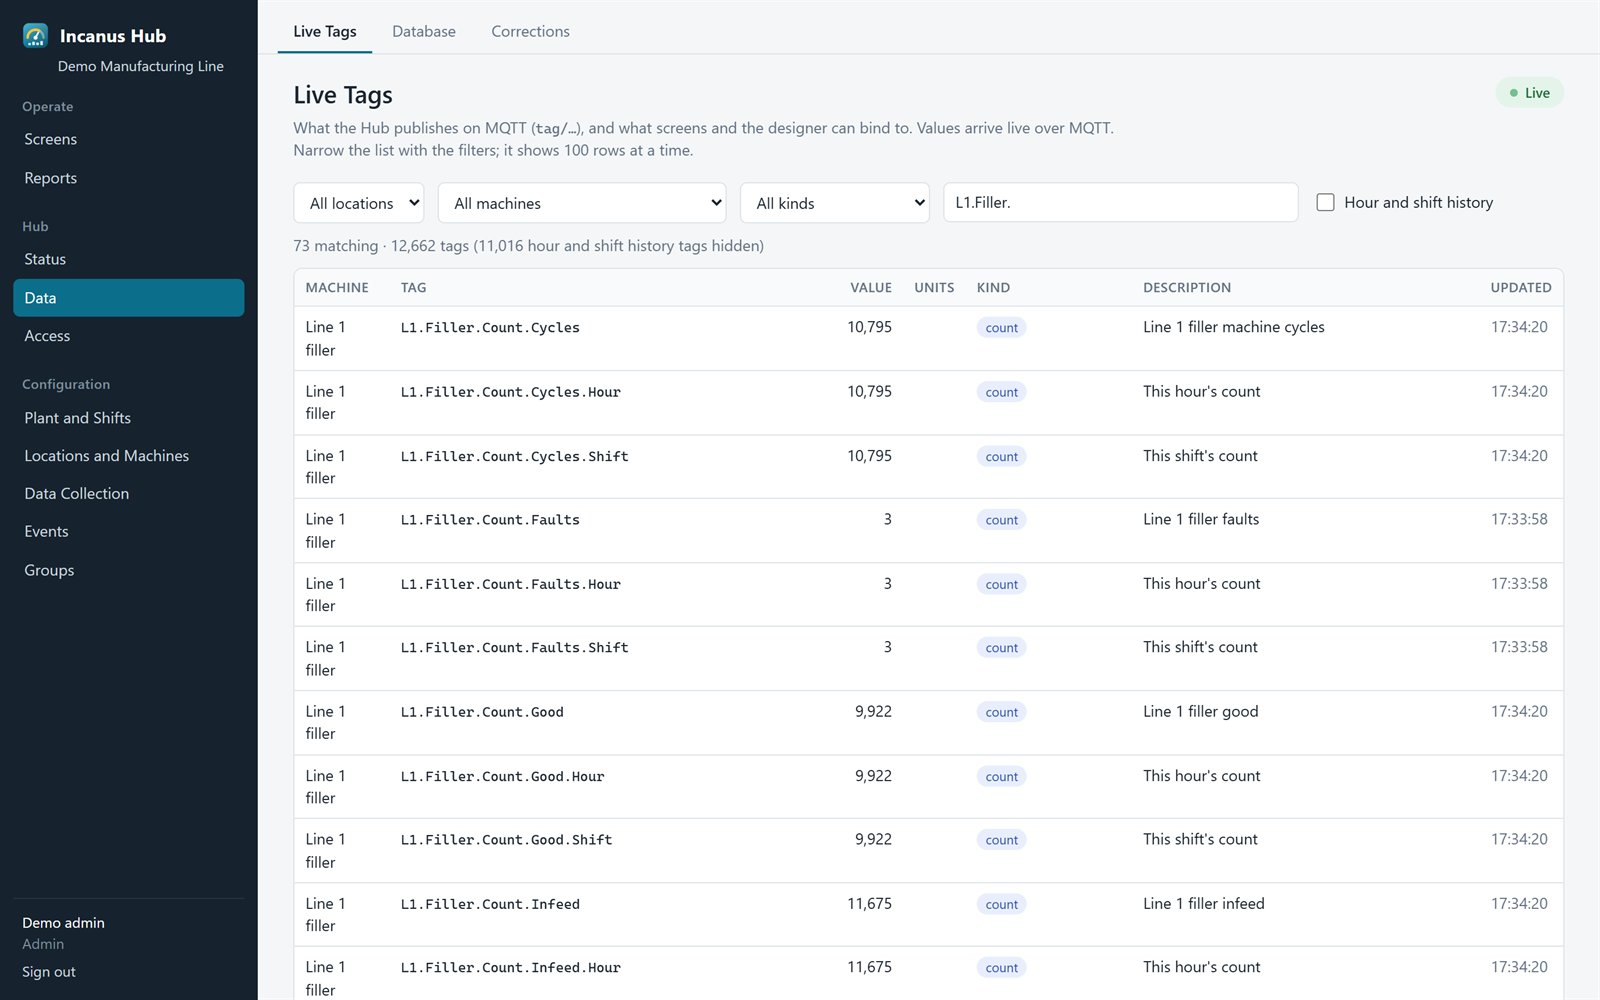
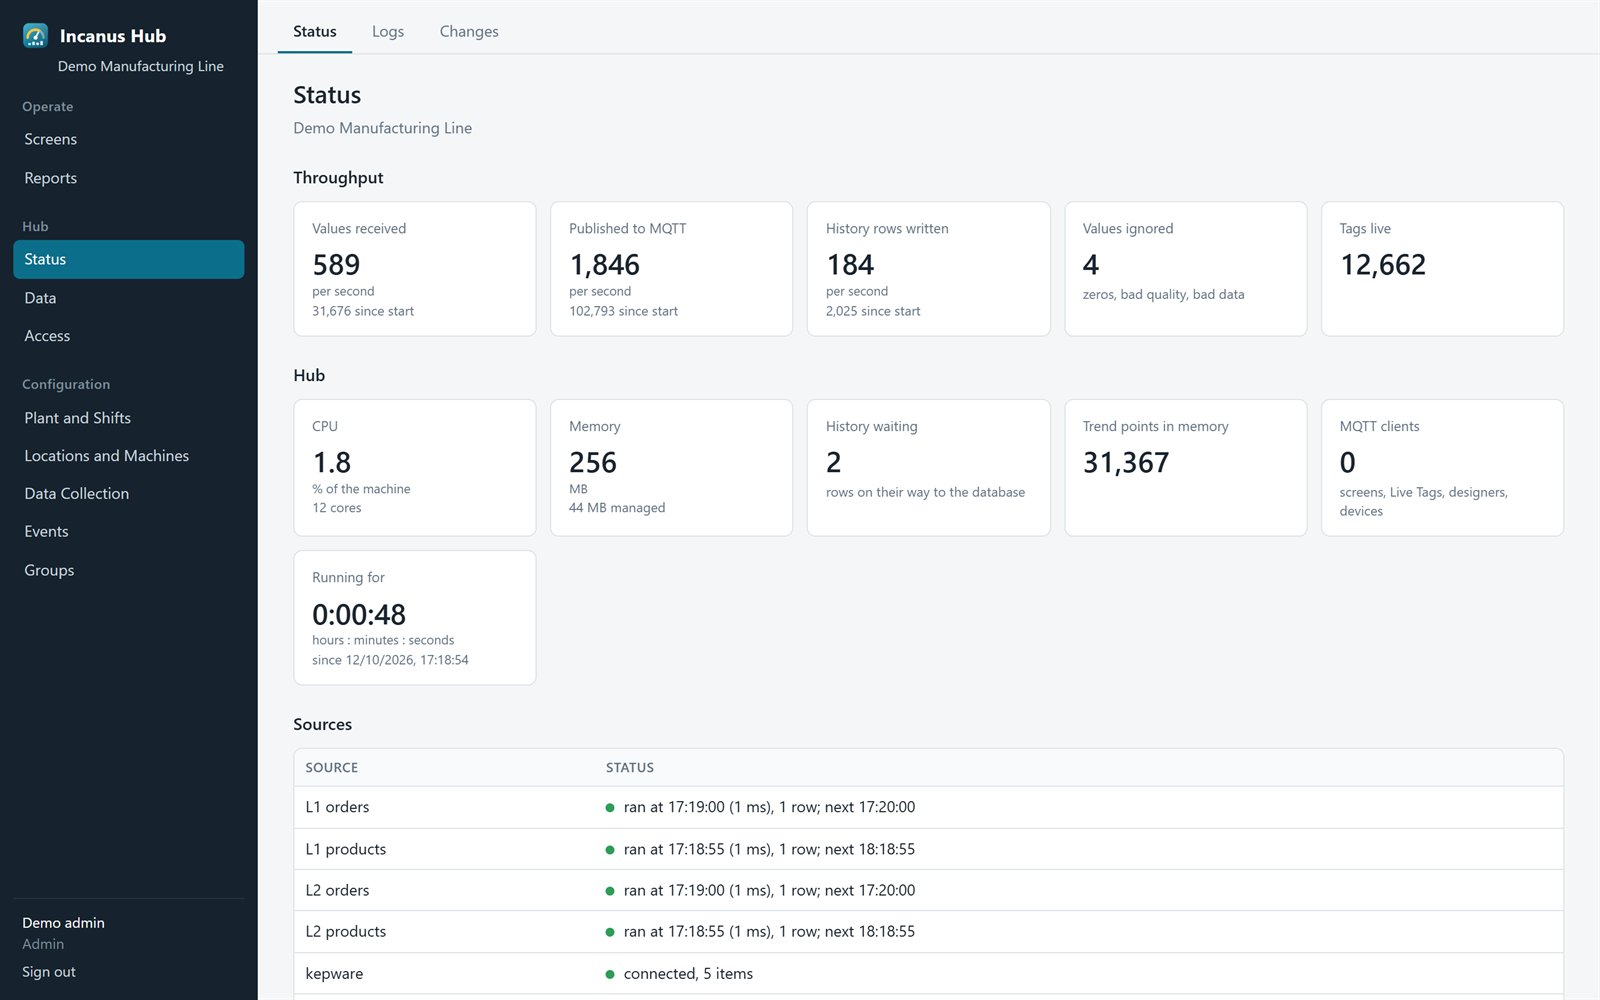
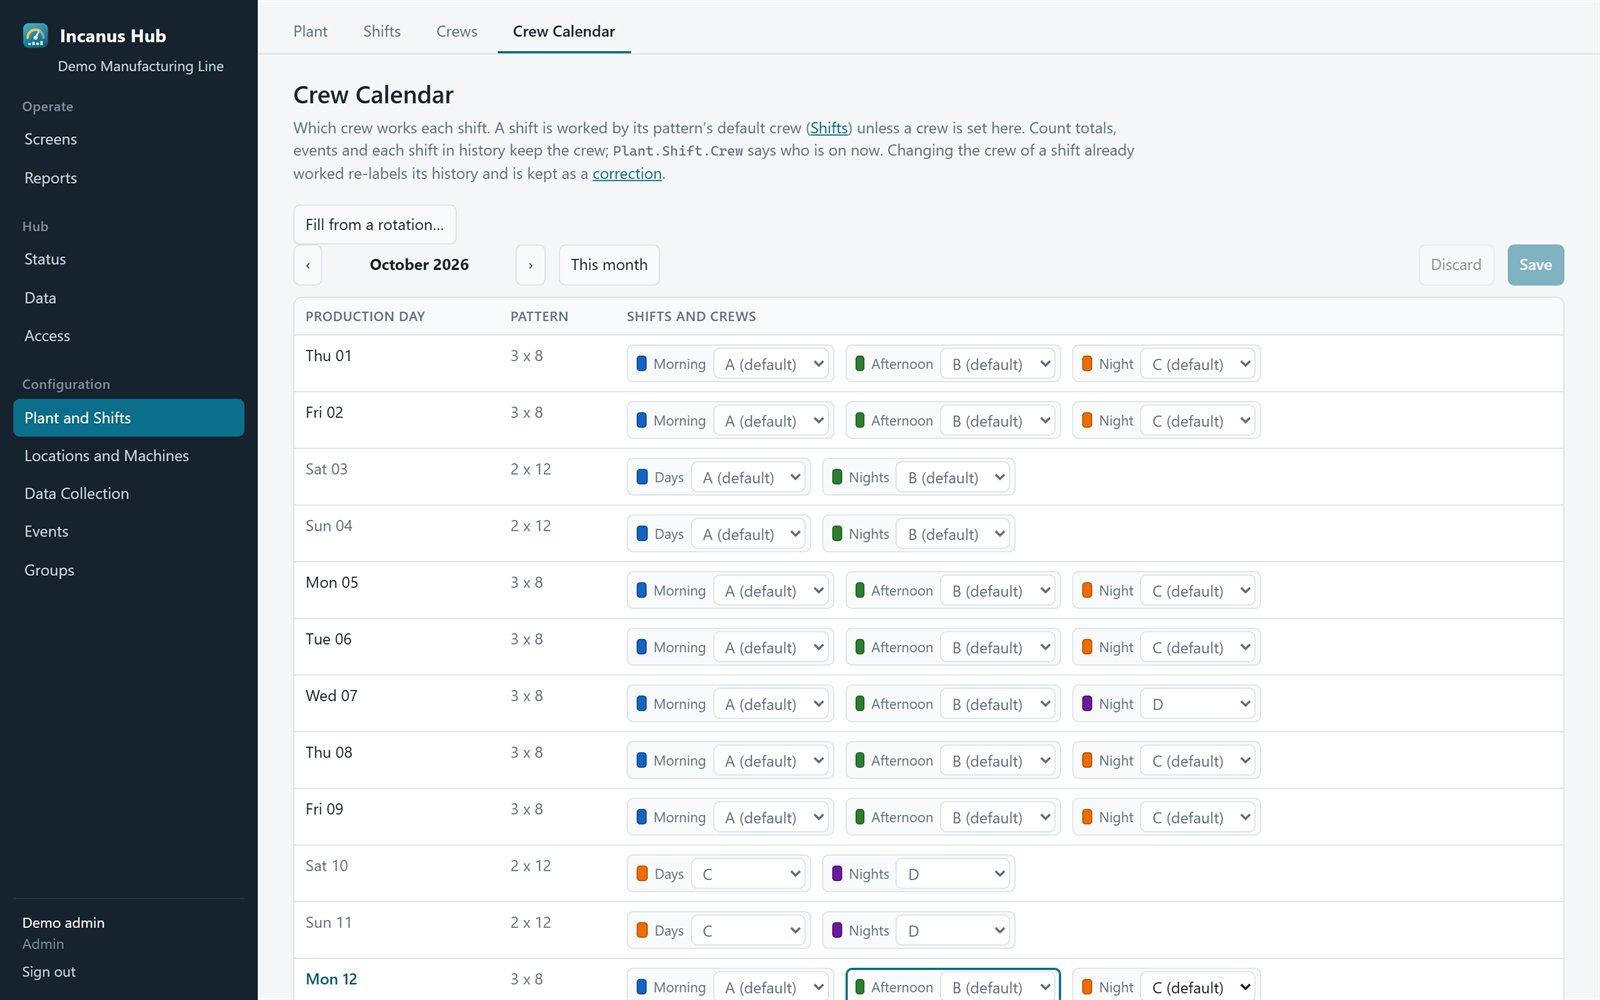
Sources, counts, monitors, machine events, shifts, crews and groups are all set up on the Hub's own web pages. Every change is checked before it's applied, logged, and can be undone.
// Coming soon
INCANUS is nearly ready. If you'd like a demonstration, want to try it on a line of your own, or would like to hear when it launches, let us know.
Register Interest